Clustering: It's Not Just For Indexers

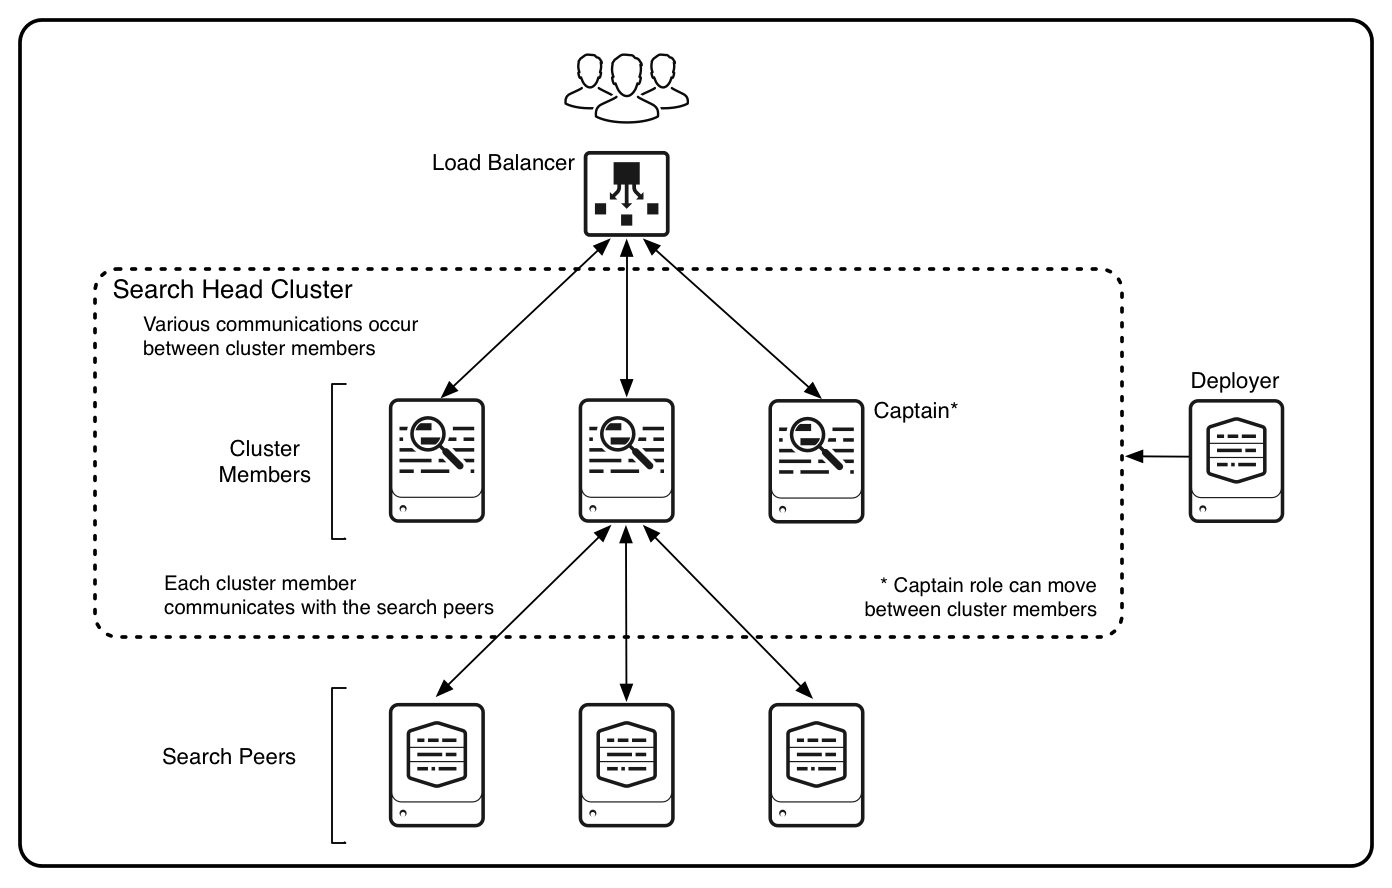
The release of Splunk Enterprise 6.2 introduced several great new features and enhancements. The new capabilities center around a new faster interface designed to assist with data onboarding, easier analytics and event pattern detection, and improved scalability and centralized management. While I would definitely recommend exploring the first two topics, this blog will focus on the latter. Core to the improvements in scalability and centralized management within Splunk Enterprise 6.2 is the introduction of Search Head Clustering. Search Head Clustering (SHC) is a direct replacement for...


Jazzing Up Your Dashboards: Dynamic Drilldown 101

Time and time again, our customers find the most value in Splunk when they can visualize their data. By using the tokenization of certain fields, customers have the ability to drilldown into certain elements of their data. Drilling down into maps, charts, and graphs within the same dashboard, gives customers the ability to pinpoint problems and solutions quickly and efficiently. Now that Splunk utilizes simple XML for dashboard design, jazzing up your dashboards is easier than ever before!

Using sample data, I will walk you through some of these dynamic features below.

...


Extending the Power of Pivot

Data models were introduced with the release of Splunk 6 back in Oct of 2013. By now, Splunk users are aware of the pivot feature that allows them to build various types of reports that are fueled by data models without having to know the Splunk Search Processing Language (SPL). The Pivot Editor is a great way to build these reports, it allows users to simply point and click their way to creating reports/charts/graphs that provide great insight. This feature is great for users that only want to use the Pivot Editor to create their reports. However, you cannot add the Pivot Editor to a...


Join Function1 at .conf2014!

It’s the most wonderful time of the year (for Splunk aficionados)! Function1 is proud to announce our Level 2 sponsorship of .conf2014: The Fifth Annual Splunk Worldwide Users’ Conference at the MGM Grand in Las Vegas. With 150 sessions and more than 70 customer presentations, it’s no surprise that .conf2014 organizers are anticipating a record attendance of more than 4,000 IT and business professionals. Introduce yourself at the Function1 booth or join us during our two breakout sessions where our Splunk-certified consultants will be offering attendees powerful insight into dynamic new...


Introducing the Red Hat Storage App for Splunk Enterprise

Welcome Splunkers! Today, we are proud to announce the release of the Red Hat Storage™ App for Splunk Enterprise™ on the Splunk Apps site.  This app is the result of collaboration between the Operational Intelligence Team at Function1 and the Red Hat Storage Server team.  The app provides operational insight for your Red Hat Storage Server (RHSS) deployment.

For those that aren’t familiar, Red Hat Storage Server

“…is an open software-defined...


Splunk Multisite Clustering

Splunk 6.1 – Introducing Multisite Clustering


With the release of Splunk Enterprise 6.1 have come many new features and enhancements. The initial reaction may be to question if upgrading to the new version is truly worth the effort. In this post I will describe one of the great new features in Splunk 6.1 that may turn your answer to that question into an unequivocal “yes”.

Introducing multisite clustering

First, allow me to propose a conundrum that many Splunk administrators within multi-site organizations may...


MS Windows, Splunk App for Enterprise Security 3.0 and the Case of the Disappearing Assets and Identities

Are you wondering where your Assets are?  Why you can't find your identities, perhaps? Are you on Windows? With the recent release of version 3.0, there has been huge improvements in the power of the ES app, and the ease of its use. The Assets and Identities are one of the cornerstones of the ES app, and there is a major change in the way these files operate in ES 3.0 compared to ES 2.4.

Asset management provides additional information about the source and targets of events. This information can be used to correlate multiple events to a single host, identify the location of the host...


Charting Time over Time in Splunk


In the business world, people are looking at ways to constantly improve processes and systems. The only way to determine if progress is being made is to compare performance over a period of time to that same period of time a day ago, a week ago, a month ago, or even longer.

Since Splunk gives companies the ability to store and search data over a variety of time periods, this should be an easy task to do, right?

Not so fast…

While Splunk is driven by time, the answer is a little more complex than that.

Let’s say for example that you would like to chart...


Accelerated Data Models in a Distributed Splunk Environment

Splunk v6.0.1 is packed with new features that enhance the user experience and can provide useful, lightning fast reports. For a full overview of the new features check out this link: Splunk 6!

One of the new features that provide users the ability to build exceptionally fast reports is data models. Users can use the structure provided by the data models to create pivot tables, all without knowing Splunk’s search language. Pivot users select the data model they are interested in, then point and click their...


Measuring Splunk Indexer Performance with IOMeter

Welcome! In this post I'd like to cover testing the I/O performance of your indexer to its storage sub-system.

'After the party, it's the hotel lobby'

You can think of your indexer as the lobby of a busy hotel with the hotel guests being your data. In this hotel, guests are constantly streaming into the lobby (raw event data). At the same time, guests are frequently leaving the hotel (search queries) to go on around the city, either periodically in buses (scheduled saved searches) or in an ad-hoc manner by taxi (user searches). To prevent the lobby from filling up from the...


Stay In Touch