Creating and Using New Custom Visualizations in Splunk 6.4

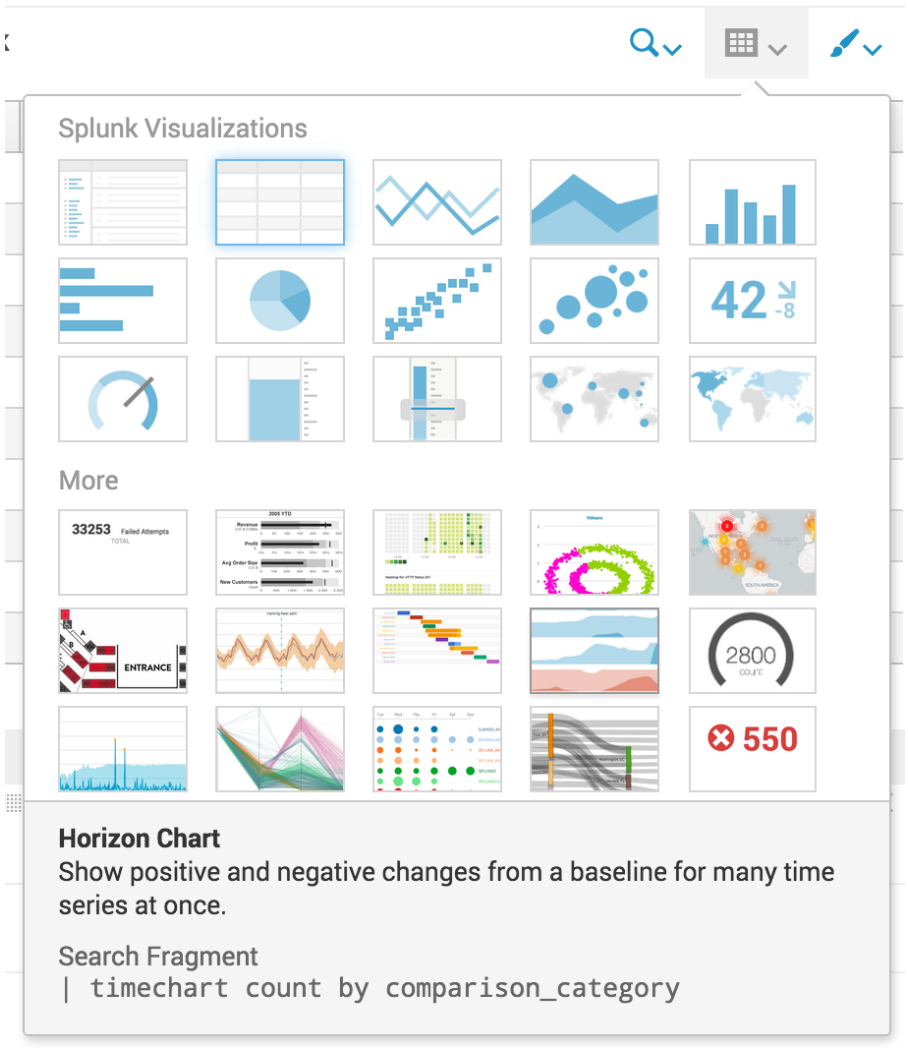
Visualizations are not new to Splunk, whether XML or (D3) JavaScript, but the visualizations offered in Splunk 6.4 are the easiest and most powerful yet!

Splunk has four large improvements to visualizations:

  1. 12 New D3 Visualizations
  2. The ability to add and extend your own visualizations to the library
  3. Developer APIs...

Trimming Down your Splunk Indexer Storage with TSIDX Retention Settings

Hi everyone.  Today I wanted to cover the tsidx retention feature that was released in Splunk version 6.4.  This feature helps you reduce the storage costs for your indexer while maintaining actively searchable data.  Also in this blog, I wanted to try a new format and convey the information in an FAQ style.  Please leave a comment if you found the new format helpful for learning about tsidx retention.

Tsidx File Fundamentals

First let's cover some fundamentals about tsidx files.

Q. What is a tsidx file?
A. Tsidx stands for "time-series index" file.  It's...


Splunk Knowledge... Share it Through Documentation

Anyone who has worked in professional services knows that technical documentation is always requested for any type of content delivery. Of course the importance of documentation extends far beyond the consulting realm, as it is always a good practice for organizations to document their technical content. In today's blog I will attempt to write a non-technical blog about documenting technical Splunk content.

So what should be included in Splunk content documentation? Here is a breakdown, by heading, of the information that I have found to be very key in any Splunk content and use...


REST Easy with the Splunk REST API

The REST API in Splunk is something that we can use in so many different ways. In this blog, I am going to go through some commands that I made to create a dashboard that could be useful for a team.


There are so many useful searches you can use within the REST API, from configurations, configurations, inputs, lookup, searches.


For my client, we wanted to be able to see permission users had, active users, top all users, and what authentication system was being used. The REST API was perfect for this!


So we wanted when the user logged on to...


On one condition...

I have found that I love creating xml code and seeing all the different capabilities it has within Splunk. While at a client recently, the client wanted to have two separate sets of dashboard inputs on one dashboard. To accomplish this, I turned to some more complex features of simple xml by creating what “appears” to be two separate dashboards; however, it’s actually just one. In creating this, my main focus areas were using “tokens” and “depends”.

I started with my Universal Input of Linux or Windows. This will be what my user sees when the dashboard initially loads.

 ...


Converting McAfee EPO ipv4x to a Readable IP Address

http://www.bennadel.com/blog/1830-converting-ip-addresses-to-and-from-in...


My current Splunk deployment is ingesting custom McAfee EPO data through Splunk Enterprise Security (ES). We are developing many use cases around this data that require us to alert/output an IP address. Currently, the McAfee EPO provides an IP address in integer form (i.e. 2130706433) and not in string/readable form (i.e. 127.0.0.1). In order to make the IP...


Monitoring Frozen Data Storage in Splunk

Frozen Wasteland

In this post, I'd like to visit the "Siberia" of Splunk data or frozen (archived) storage.  For all other types of data besides frozen, you can get insight on your Splunk data at the index and bucket level by using the "dbinspect" command or apps like "Fire Brigade."  However, because frozen data "lives" outside of the world of Splunk, there's no way to get insight on that data via Splunk.  Therefore, I will outline a solution for creating a scripted input to send metrics to Splunk which can then be used for reporting.

Create the...


How to generate 1 TB of data for Splunk Performance Testing

HOW TO GENERATE 1 TB OF DATA FOR SPLUNK PERFORMANCE TESTING


INTRODUCTION

Splunk, a leader in Event Management provides insight into your business’s machine-generated log data. Splunk enables you to make sense of your business, make smart decisions and initiate corrective actions.

Processing Big Data is by no means a small feat. The ability to scale Splunk to accommodate and grow with your business is key to providing reliable and accurate information.  Splunk provides insight into your...


Data Model Acceleration Enforcement

Data Model Acceleration Enforcement

We have seen a few customers run into the following "gotcha" regarding data model acceleration.  Whether it be for temporary or permanent reasons, a user disables acceleration on a data model, which myesteriously is re-enabled after a restart.  To counter this, a feature called Data Model Acceleration Enforcement allows administrators to lock acceleration.  This feature is found under "Setting" > "Data Models."  Here’s how it works:

Through the user interface:

I will be using one of the default...


Automating File Transfer: Using Bash Scripts to Place Reports on Remote Servers

While working with Splunk, I’ve come across unique requests that are specific to an organization. In some cases, Splunk customers within an organization do not have Splunk access to run their own saved searches and reports. This requires the Splunk team to create the saved search, generate the report, and send the report to the Splunk customer. Splunk can send a report by email after the search is ran, but this option is not practical if a search runs multiple times a day. A better option would be to place the report on a server, accessible to the customer, every time the saved search is...


Stay In Touch