Time and time again, our customers find the most value in Splunk when they can visualize their data. By using the tokenization of certain fields, customers have the ability to drilldown into certain elements of their data. Drilling down into maps, charts, and graphs within the same dashboard, gives customers the ability to pinpoint problems and solutions quickly and efficiently. Now that Splunk utilizes simple XML for dashboard design, jazzing up your dashboards is easier than ever before!
Using sample data, I will walk you through some of these dynamic features below.
Scenario 1: Mapping with GeoStats
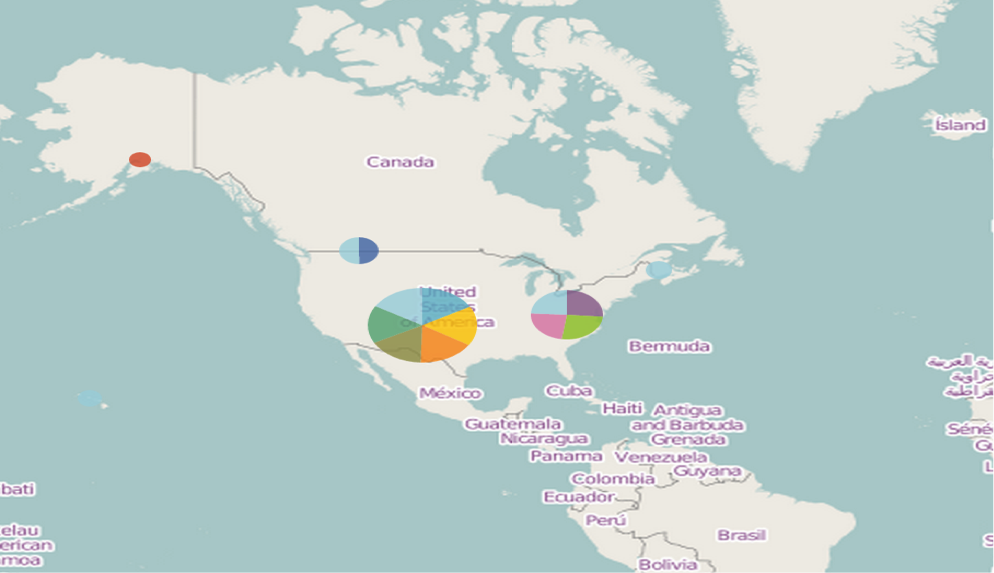
Let’s examine the XML associated with the above map.
<map>
<searchString>index=nmk_shirt_sales| geostats latfield=vendor_latitude longfield=vendor_longitude count by store_city| head 10</searchString>
<earliestTime/>
<latestTime/>
<option name="charting.axisLabelsX.majorLabelStyle.overflowMode">ellipsisNone</option>
<option name="charting.axisLabelsX.majorLabelStyle.rotation">0</option>
<option name="charting.axisTitleX.visibility">visible</option>
<option name="charting.axisTitleY.visibility">visible</option>
<option name="charting.axisTitleY2.visibility">visible</option>
<option name="charting.axisX.scale">linear</option>
<option name="charting.axisY.scale">linear</option>
<option name="charting.axisY2.enabled">0</option>
<option name="charting.axisY2.scale">inherit</option>
<option name="charting.chart">area</option>
<option name="charting.chart.nullValueMode">gaps</option>
<option name="charting.chart.sliceCollapsingThreshold">0.01</option>
<option name="charting.chart.stackMode">default</option>
<option name="charting.chart.style">shiny</option>
<option name="charting.drilldown">all</option>
<option name="charting.layout.splitSeries">0</option>
<option name="charting.legend.labelStyle.overflowMode">ellipsisMiddle</option>
<option name="charting.legend.placement">right</option>
<option name="mapping.data.maxClusters">100</option>
<option name="mapping.map.center">(0,0)</option>
<option name="mapping.map.zoom">2</option>
<option name="mapping.markerLayer.markerMaxSize">50</option>
<option name="mapping.markerLayer.markerMinSize">10</option>
<option name="mapping.markerLayer.markerOpacity">0.8</option>
<option name="mapping.tileLayer.maxZoom">20</option>
<option name="mapping.tileLayer.minZoom">0</option>
<option name="mapping.tileLayer.url">http://{s}.tile.openstreetmap.org/{z}/{x}/{y}.png</option>
<option name="mapping.tileLayer.subdomains">[a,b,c]</option>
<option name="drilldown">all</option>
</map>
I have bolded a few portions of this XML to dissect in detail. The first portion, the search string, uses the geostats command to isolate both the latitude and longitude coordinates of each store. Splunk, then, plots these coordinates accordingly on the map by the store's city location. The second highlighted portion, the openstreetmap, is a type of map you can use within Splunk. Splunk allows you to customize and incorporate different map views based on the user’s preference. The rest of the XML is populated automatically when you select the map option under the visualization tab and place it into a report or dashboard.
So, what if you want to incorporate a time picker and populate a map based upon the time range chosen by the user?
Scenario 2: Tokenization of Time to Populate a Map
(Please note: the tokenization of the time field can be used to populate a map, chart, graph, etc. For our example, we will continue using a map)
<form>
<label>Blog Visuals Q3</label>
<fieldset submitButton="false">
<input type="time" searchWhenChanged="true" token="time_tok">
<label/>
<default>
<earliestTime>0</earliestTime>
<latestTime/>
</default>
</input>
</fieldset>
<row>
<panel>
<map>
<searchString>index=nmk_shirt_sales| geostats latfield=vendor_latitude longfield=vendor_longitude count by store_city| head 10</searchString>
<earliestTime>$time_tok.earliest$</earliestTime>
<latestTime>$time_tok.latest$</latestTime>
<option name="charting.axisLabelsX.majorLabelStyle.overflowMode">ellipsisNone</option>
<option name="charting.axisLabelsX.majorLabelStyle.rotation">0</option>
<option name="charting.axisTitleX.visibility">visible</option>
<option name="charting.axisTitleY.visibility">visible</option>
<option name="charting.axisTitleY2.visibility">visible</option>
<option name="charting.axisX.scale">linear</option>
<option name="charting.axisY.scale">linear</option>
<option name="charting.axisY2.enabled">0</option>
<option name="charting.axisY2.scale">inherit</option>
<option name="charting.chart">area</option>
<option name="charting.chart.nullValueMode">gaps</option>
<option name="charting.chart.sliceCollapsingThreshold">0.01</option>
<option name="charting.chart.stackMode">default</option>
<option name="charting.chart.style">shiny</option>
<option name="charting.drilldown">all</option>
<option name="charting.layout.splitSeries">0</option>
<option name="charting.legend.labelStyle.overflowMode">ellipsisMiddle</option>
<option name="charting.legend.placement">right</option>
<option name="mapping.data.maxClusters">100</option>
<option name="mapping.map.center">(0,0)</option>
<option name="mapping.map.zoom">2</option>
<option name="mapping.markerLayer.markerMaxSize">50</option>
<option name="mapping.markerLayer.markerMinSize">10</option>
<option name="mapping.markerLayer.markerOpacity">0.8</option>
<option name="mapping.tileLayer.maxZoom">20</option>
<option name="mapping.tileLayer.minZoom">0</option>
<option name="mapping.tileLayer.url">http://{s}.tile.openstreetmap.org/{z}/{x}/{y}.png</option>
<option name="mapping.tileLayer.subdomains">[a,b,c]</option>
<option name="drilldown">all</option>
</map>
</panel>
</row>
</form>
I’ve bolded the only two changes made to the simple XML to enable the tokenization of time via a time picker. The first highlighted portion designates the token to be set to time and will change the contents of the map based on this designated field. The second highlighted portion within the XML tells the search that it should populate the associated map based upon the time token. The rest of the XML does not change and from here you can customize the contents of the map based on the user’s chosen time range.
But what if I want to click into the contents of my map to populate a chart and still maintain the time token? Can Splunk make this crazy request a reality?! YES!
Scenario 3: Dynamic Drilldown from Map with Time Token from Timepicker
<form>
<label>Blog Visuals Q3</label>
<fieldset submitButton="false">
<input type="time" searchWhenChanged="true" token="time_tok">
<label/>
<default>
<earliestTime>0</earliestTime>
<latestTime/>
</default>
</input>
</fieldset>
<row>
<panel>
<map>
<searchString>index=nmk_shirt_sales| geostats latfield=vendor_latitude longfield=vendor_longitude count by store_city| head 10</searchString>
<earliestTime>$time_tok.earliest$</earliestTime>
<latestTime>$time_tok.latest$</latestTime>
<option name="charting.axisLabelsX.majorLabelStyle.overflowMode">ellipsisNone</option>
<option name="charting.axisLabelsX.majorLabelStyle.rotation">0</option>
<option name="charting.axisTitleX.visibility">visible</option>
<option name="charting.axisTitleY.visibility">visible</option>
<option name="charting.axisTitleY2.visibility">visible</option>
<option name="charting.axisX.scale">linear</option>
<option name="charting.axisY.scale">linear</option>
<option name="charting.axisY2.enabled">0</option>
<option name="charting.axisY2.scale">inherit</option>
<option name="charting.chart">area</option>
<option name="charting.chart.nullValueMode">gaps</option>
<option name="charting.chart.sliceCollapsingThreshold">0.01</option>
<option name="charting.chart.stackMode">default</option>
<option name="charting.chart.style">shiny</option>
<option name="charting.drilldown">all</option>
<option name="charting.layout.splitSeries">0</option>
<option name="charting.legend.labelStyle.overflowMode">ellipsisMiddle</option>
<option name="charting.legend.placement">right</option>
<option name="mapping.data.maxClusters">100</option>
<option name="mapping.map.center">(0,0)</option>
<option name="mapping.map.zoom">2</option>
<option name="mapping.markerLayer.markerMaxSize">50</option>
<option name="mapping.markerLayer.markerMinSize">10</option>
<option name="mapping.markerLayer.markerOpacity">0.8</option>
<option name="mapping.tileLayer.maxZoom">20</option>
<option name="mapping.tileLayer.minZoom">0</option>
<option name="mapping.tileLayer.url">http://{s}.tile.openstreetmap.org/{z}/{x}/{y}.png</option>
<option name="mapping.tileLayer.subdomains">[a,b,c]</option>
<drilldown>
<set token="store_city">$click.name$</set>
<set token="form.store_city">$click.name$</set>
</drilldown>
</map>
</panel>
</row>
<row>
<panel>
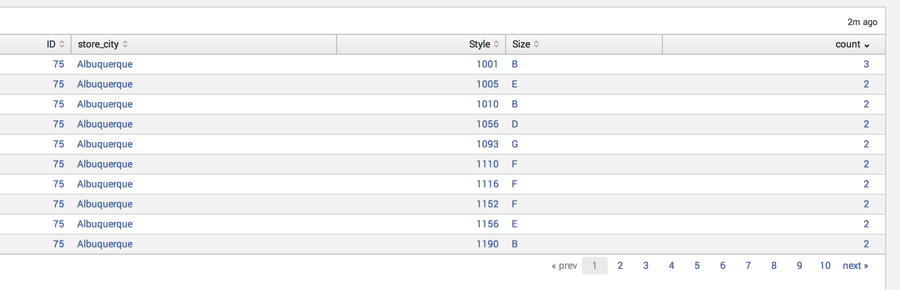
<table id="detail" depends="$store_city$">
<searchString>index=nmk_shirt_sales store_city=$store_city$| stats count by ID, store_city, Style, Size</searchString>
<earliestTime>$time_tok.earliest$</earliestTime>
<latestTime>$time_tok.latest$</latestTime>
</table>
</panel>
</row>
</form>
I’ve bolded the necessary additions to the XML that enables a dynamic drilldown from the map to an associated table. Within the map, you are going to want to set the field in which you will want to pass the token from to the new table under the drilldown stanza. I have designated the store_city as being the field in which the user will click on to drilldown into the new associated table. Remember, your new table will be dependent on this field. Once the user clicks on a store_city within the map, an associated table will populate with the outlined search string listed above. The time range for this table will depend on the time token that is being passed between the map and the chart as designated in the time picker.
If you want to drilldown again, from the associated table to a new chart, table, or map, all you have to do is repeat the steps in scenario 3 (setting a token within the drilldown and making the search string dependent on that token) and voila! It’s truly spirit fingers for your dashboards.
If you have any questions or need further information, please contact us at info@function1.com. Happy Splunking!