Measuring Splunk Indexer Performance with IOMeter
Welcome! In this post I'd like to cover testing the I/O performance of your indexer to its storage sub-system.
'After the party, it's the hotel lobby'
You can think of your indexer as the lobby of a busy hotel with the hotel guests being your data. In this hotel, guests are constantly streaming into the lobby (raw event data). At the same time, guests are frequently leaving the hotel (search queries) to go on around the city, either periodically in buses (scheduled saved searches) or in an ad-hoc manner by taxi (user searches). To prevent the lobby from filling up from the incoming stream of people and to make sure it doesn't take too long for people to leave the hotel, the elevator system (disk I/O) must be extremely performant.
Hopefully the analogy makes a bit of sense. Essentially, disk I/O is extremely important to Splunk indexers and will normally be the bottleneck in search performance. It's also becoming more important in search head pool configurations as things like TSIDX data (which is stored at the search head tier) in apps like Enterprise Security are being introduced. As part of an initial deployment or perhaps a health check, it's important to measure the I/O performance to your storage. Splunk recommends the storage system be capable of an average of 1200 IOPS (Splunk reference hardware specs). Here's a few factors that affect I/O performance with values from Splunk's reference hardware example where applicable:
- Disk speed (15K)
- RAID configuration (RAID 1+0)
- storage connection type (SAS)
- Disk access profile (mostly random)
The first three items in the list are dependent on the storage hardware and configuration. The last item, depends on the application that's using the storage. In this case, the application is Splunk which generally has a random storage access profile. In order to have a successful and well-performing Splunk deployment it's important to take the storage recommendations seriously and invest in a system that meets the requirements.
The Right Tool for the Job
So now that we covered why it's important to measure I/O performance, we'll get into how to do that. We'll be focusing on Windows systems here. There's a tool called IOMeter that was originally developed by Intel and then open-sourced. This is essentially the industry standard for measuring I/O performance on Windows systems. There are plenty of good tutorials and references available on the web to cover this. What'd I'd cover here are some guidelines on how to configure the tool to mimic Splunk's storage access profile. Depending on the environment some settings may need to be tweaked. In recent testing, I used a 64-bit release candidate version (version 1.1.0-rc1) of the tool. The last stable release is only 32-bit. The tool seemed to work pretty well, although I had some issues with importing and exporting test configuration.
Configuration
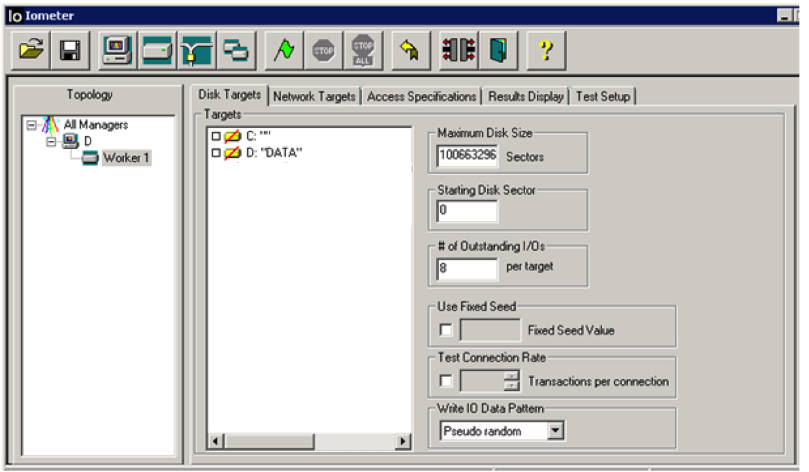
Disk Targets - Maximum Disk Size
The next setting to modify is the "Maximum Disk Size." This specifies the size of the file used when running the test. The guidance here is to set this value to be 3 times the amount of memory on the server. The reason to do this is to make sure that the test files is not being cached entirely in the server's memory. The "Maximum Disk Size" setting is specified in sectors. A sector is equivalent to 512 bytes. In this example the server has 16 GB of RAM. So we want to calculate how many sectors are in 48 GB of RAM (3 x 16GB). I'll spare you the math here but that equals 100,663,296 sectors (you can simply type "48GB / 512 bytes" into Google in order to get the value).
Disk Targets - # of Outstanding I/Os
The "# of Outstanding I/Os" should be set to 8 or 16. Ideally this value is increased to the point at which it stops affecting I/O results. You can run the test a few times with different numbers to discover this number for your system.
Disk Targets - Write IO Data Pattern
This setting configures the pattern of writes to the storage during the test. This should not be set to "repeating bytes." During recent testing I've been setting this to "pseudo-random" which is the setting that was used in the last stable release of the tool.
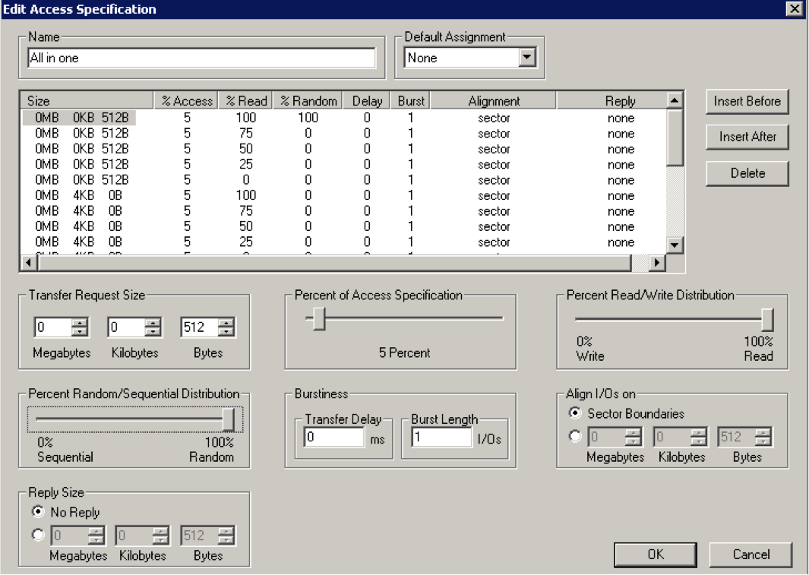
The next items to configure are in the the "Access Specification" tab. This tab shows different access profiles based on data size and percentage of reads vs. writes. I've been using the "all-in-one" profile which contains all the tests. The picture above shows the edit screen for that profile. On this screen you'll want to select each access profile listed in the pane and set the "Percent Random/Sequential Distribution" slider all the way to the right for "100% Random."
Conclusion
The tool is now configured to mimic how a Splunk indexer will interact with its storage sub-system which should yield more accurate test results. Storage vendors will configure tests to show the highest performance values, even though this may not be reflective of your actual use case. Remember, because Splunk is such an I/O intensive application it's important to have a well-performing storage system which can be verified by tools like IOMeter.
P.S. It's not covered in this post, but for Linux systems you'll want to use a tool called bonnie++.
Thanks for reading!
Featured Image courtesy of http://www.freedigitalphotos.net/
- Log in to post comments
