Using C3.js to Create a Custom Visualization in Splunk

Introduction

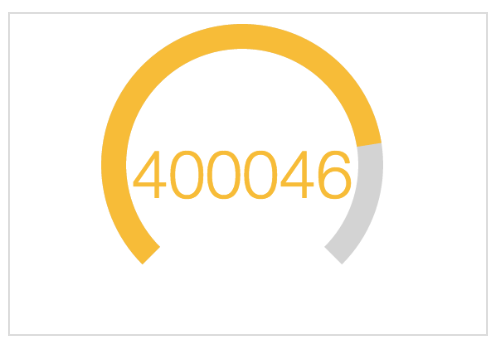
Data visualizations in Splunk are an extremely powerful way to analyze and derive value from the mountains of data collected every day. Today, I’d like to cover how to create a custom visualization in Splunk using the C3.js library, which is built on top of the extremely popular and powerful D3.js data visualization library. One of the advantages of using C3 is that the syntax is somewhat simpler to use than D3. While “D3” stands for “Data-drive Documents,” “C3” stands for “Comfortable,...


Enhance your WCS Dashboard Widgets with D3.js

As far back as I can remember, WebCenter Sites' Contributor UI dashboard widgets have been simple HTML tables full of text. Behold, D3.js, a JavaScript library that helps "bring your data to life" and easily create animated graphics. 

A good use case for this is the two dashboard widgets that come with Function1's LingoTek inside WebCenter Sites product (pictured below), which simply show some numbers about recent activity between WCS and Lingotek.


...


Creating a Custom D3 Application with Visualizations in Splunk

This is a slightly lengthy tutorial on creating your own D3 (or any other open source JavaScript library) visualization and app for use in Splunk. It assumes familiarity with creating Splunk Apps, as well as with JavaScript, and as such is at a more intermediate level: before creating this app, you might want to work on both your JavaScript skills and work on creating some Splunk visualizations with Splunk JS or Simple XML. You...


Creating and Using New Custom Visualizations in Splunk 6.4

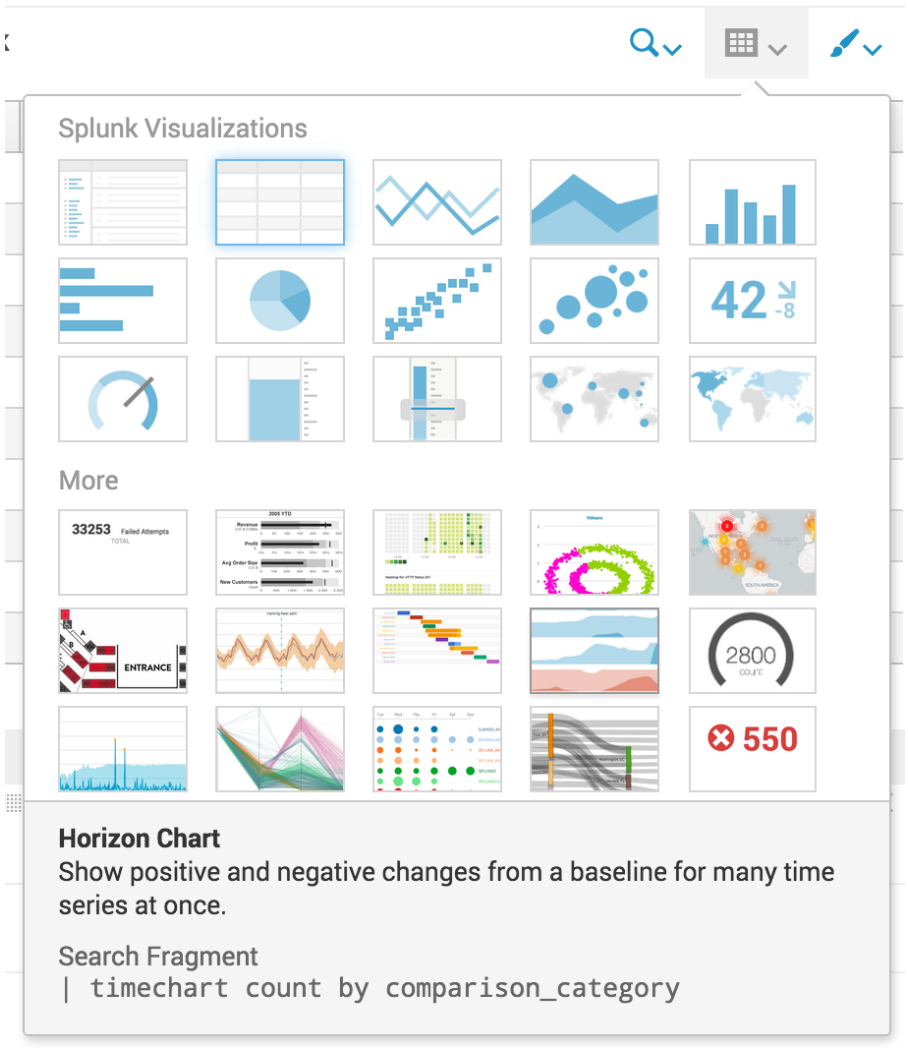
Visualizations are not new to Splunk, whether XML or (D3) JavaScript, but the visualizations offered in Splunk 6.4 are the easiest and most powerful yet!

Splunk has four large improvements to visualizations:

  1. 12 New D3 Visualizations
  2. The ability to add and extend your own visualizations to the library
  3. Developer APIs...

Adding D3 Visualizations to Splunk Dashboards

Introduction

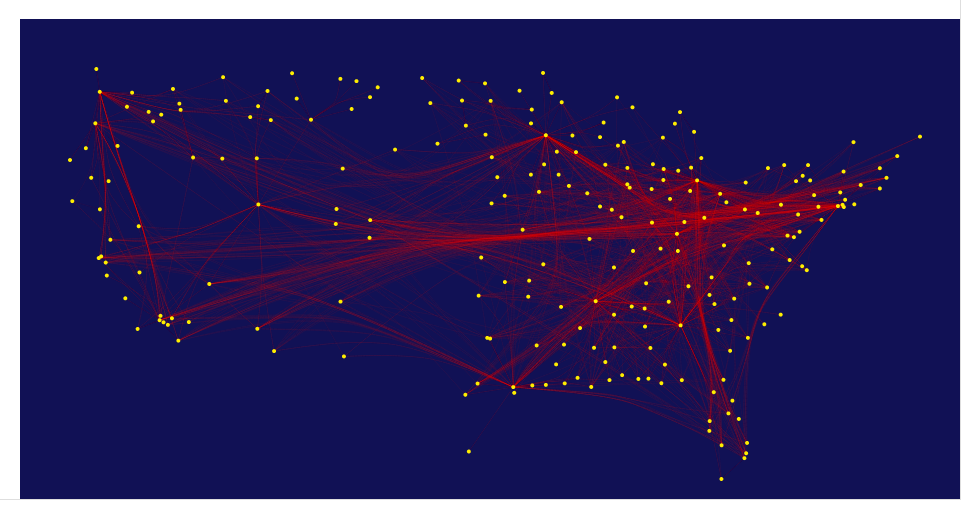
In this post I would like to cover how to add some really great visualizations to a dashboard in Splunk.  I will cover how to use D3.js, a third-party javascript visualization library, and Splunk's JS stack. 

D3.js (or just D3 for Data-Driven Documents) is a “JavaScript library that uses digital data to drive the...


Stay In Touch