REST Easy with the Splunk REST API

The REST API in Splunk is something that we can use in so many different ways. In this blog, I am going to go through some commands that I made to create a dashboard that could be useful for a team.
There are so many useful searches you can use within the REST API, from configurations, configurations, inputs, lookup, searches.
For my client, we wanted to be able to see permission users had, active users, top all users, and what authentication system was being used. The REST API was perfect for this!
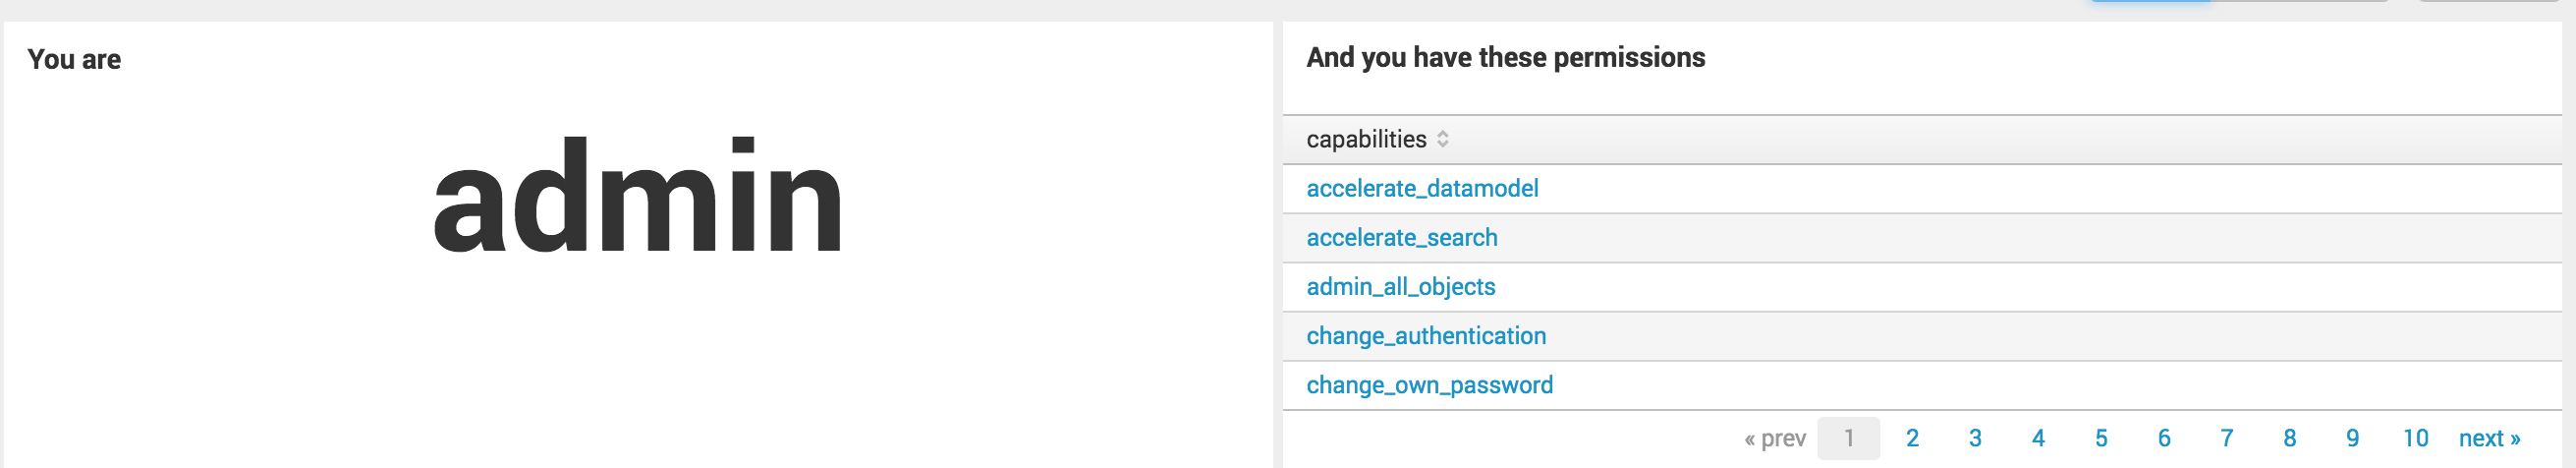
So we wanted when the user logged on to this dashboard they could see who they were and what permissions they had within Splunk.
Looking into the REST API we came up with some searches:
| rest /services/authentication/current-context | where NOT username="splunk-system-user" | fields username
and
| rest /services/authentication/current-context | where NOT username="splunk-system-user" | fields capabilities | mvexpand capabilities
From there we started building on it to get some more uses for the company including who were the active users in a particular Splunk Environment, authentication, and so much more that can be done with the REST API
Here is the final XML that was created that you can pop into your instance:
<dashboard>
  <label>REST API: access control</label>
  <row>
    <panel>
      <single>
        <title>You are</title>
        <searchString>| rest /services/authentication/current-context | where NOT username="splunk-system-user" | fields username</searchString>
        <earliestTime>0</earliestTime>
        <latestTime/>
        <option name="drilldown">none</option>
      </single>
    </panel>
    <panel>
      <table>
        <title>And you have these permissions</title>
        <searchString>| rest /services/authentication/current-context | where NOT username="splunk-system-user" | fields capabilities | mvexpand capabilities</searchString>
        <earliestTime>0</earliestTime>
        <latestTime/>
        <option name="wrap">true</option>
        <option name="rowNumbers">false</option>
        <option name="dataOverlayMode">none</option>
        <option name="drilldown">cell</option>
        <option name="count">5</option>
      </table>
    </panel>
  </row>
  <row>
    <panel>
      <table>
        <title>Active users (sessions)</title>
        <searchString>| rest /services/authentication/httpauth-tokens | fields userName, timeAccessed | dedup userName sortby timeAccessed</searchString>
        <earliestTime>0</earliestTime>
        <latestTime/>
        <option name="wrap">true</option>
        <option name="rowNumbers">false</option>
        <option name="dataOverlayMode">none</option>
        <option name="drilldown">cell</option>
        <option name="count">10</option>
      </table>
    </panel>
    <panel>
      <table>
        <title>All users (limited to 100)</title>
        <searchString>| rest /services/authentication/users | fields title, realname | head 100</searchString>
        <earliestTime>0</earliestTime>
        <latestTime/>
        <option name="wrap">true</option>
        <option name="rowNumbers">false</option>
        <option name="dataOverlayMode">none</option>
        <option name="drilldown">cell</option>
        </table>
    </panel>
    <panel>
      <chart>
        <title>Users by authentication system</title>
        <searchString>| rest /services/authentication/users | fields title, type | stats count by type</searchString>
        <earliestTime>0</earliestTime>
        <latestTime/>
        <option name="charting.axisLabelsX.majorLabelStyle.overflowMode">ellipsisNone</option>
        <option name="charting.axisLabelsX.majorLabelStyle.rotation">0</option>
        <option name="charting.axisTitleX.visibility">visible</option>
        <option name="charting.axisTitleY.visibility">visible</option>
        <option name="charting.axisTitleY2.visibility">visible</option>
        <option name="charting.axisX.scale">linear</option>
        <option name="charting.axisY.scale">linear</option>
        <option name="charting.axisY2.enabled">false</option>
        <option name="charting.axisY2.scale">inherit</option>
        <option name="charting.chart">pie</option>
        <option name="charting.chart.nullValueMode">gaps</option>
        <option name="charting.chart.sliceCollapsingThreshold">0.01</option>
        <option name="charting.chart.stackMode">default</option>
        <option name="charting.chart.style">shiny</option>
        <option name="charting.drilldown">all</option>
        <option name="charting.layout.splitSeries">0</option>
        <option name="charting.legend.labelStyle.overflowMode">ellipsisMiddle</option>
        <option name="charting.legend.placement">right</option>
      </chart>
    </panel>
  </row>
</dashboard>
Tell me how you use the REST API and if this was a helpful dashboard for your environment!
- Log in to post comments
