Year in Review: Function1's Most Popular Articles of 2016

It's the most wonderful time of the year - not because of the presents and the parties - but, the lists! I mean, who doesn't love lists (besides maybe The New Yorker)? So, we decided to put our analytics hats on and pull together our top 5 most widely-read posts of 2016. And, while our year in review might not be as much of an emotional rollercoaster as Google's ...


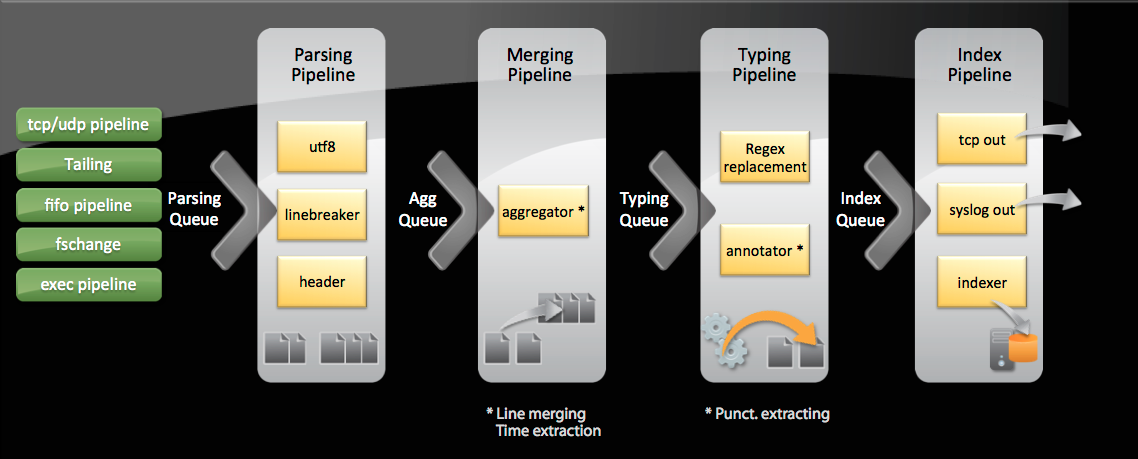
Splunk Data Input Pipeline and Processors

Image courtesy of the Splunk on Splunk App

I was a recent attendee of Splunk’s worldwide user’s conference .conf 2012. It was held at the ultra modern and chic Cosmopolitan Hotel located in the heart of Las Vegas, Nevada.  Over 1000 people attended the conference and there were 90+ information sessions geared towards a wide range of Splunk user levels. At any given moment over the 3-day conference, there were 12-16 sessions going on at the same time. There was literally a world of knowledge being handed out to anyone who...


The Seven Dwarfs of Data On-boarding in Splunk

In my time working with and using Splunk, I have learned a few tricks and tips to make the Splunk experience even better. This post assumes you are familiar with a few Splunk keywords. If you are having trouble following along, take a look at this link and look up the terms: http://docs.splunk.com/Splexicon. If you have never seen Splunk before, I suggest taking a look at the Splunk Tutorial to familiarize yourself with the product: ...


Then One Day It Happens...

Image: nokhoog_buchachon / FreeDigitalPhotos.net

You’ve joined an elite team of engineers and administrators tasked to oversee your company’s technological needs.  As your company’s ambitious marketing teams generate more and more buzz, you find that with each day your job circles increasingly around growing your business’s capacity.  Months go by filled with unhindered efforts in project completion.  You’ve helped double your web traffic, beef up your network, and revamp your monitoring system.  ...


Using the Visualization Editor to Create a Dashboard in Splunk 4.3

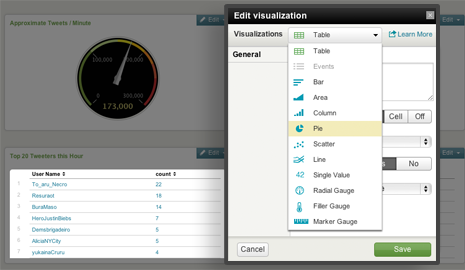
Hello world!  This is my first blog post with Function1 and I hope you find it useful. This post will give you an idea of how simple it is to use the new Visualization Editor in Splunk 4.3 to create a dashboard. This neat new feature is great because it simplifies the dashboard and panel creation process by allowing any user to create a custom dashboard without having to write any XML code and/or book time and consult with the IT guy! Each Splunk user can create their very own custom dashboard with panels that can include a table, pie chart, line graph, or a variety of other options with...


Analyzing the word Analytics in an ever-increasing Analytical world

As you can tell from the preposterous article title, I take exception to the use, overuse, and misuse of the word Analytics. From the day the first person uttered this word, the word has taken on a life of its own. Analytics at a basic level simply means to distill data so that some information/knowledge can be gleamed in the hopes of making better informed decisions in the business arena or any other for that matter. Early Analytics came in the form of a simple spreadsheet tool such as excel and was a means to do decision , what-if or scenario analysis. Spreadsheets can be used to perform...


Analytics Tip

Analytics does a good job tracking hits and visits to any of the portal’s knowledge directory cards (documents and URLs.)  But, often enough, we don’t view the KD cards by navigating the directory and browsing its content since we might want to reference certain cards through Publisher content items or through custom apps using <HREF> tags.   If tracking hits for such cards isn’t essential, then it is safe to just plug the gatewayed URL to that document as in:

<A HREF=" http://<PortalServerHost...


Stay In Touch