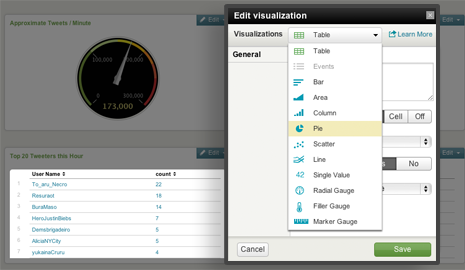
Hello world! This is my first blog post with Function1 and I hope you find it useful. This post will give you an idea of how simple it is to use the new Visualization Editor in Splunk 4.3 to create a dashboard. This neat new feature is great because it simplifies the dashboard and panel creation process by allowing any user to create a custom dashboard without having to write any XML code and/or book time and consult with the IT guy! Each Splunk user can create their very own custom dashboard with panels that can include a table, pie chart, line graph, or a variety of other options with...
Using the Visualization Editor to Create a Dashboard in Splunk 4.3
Posted by Rupak Pandya
on Thursday, April 5, 2012 - 16:09
Operational Intelligence, Cool Tools Analytics, Cool Tools, Dashboards, Simple XML, Splunk, UI, Visual, Visualization