Splunk Data Input Pipeline and Processors
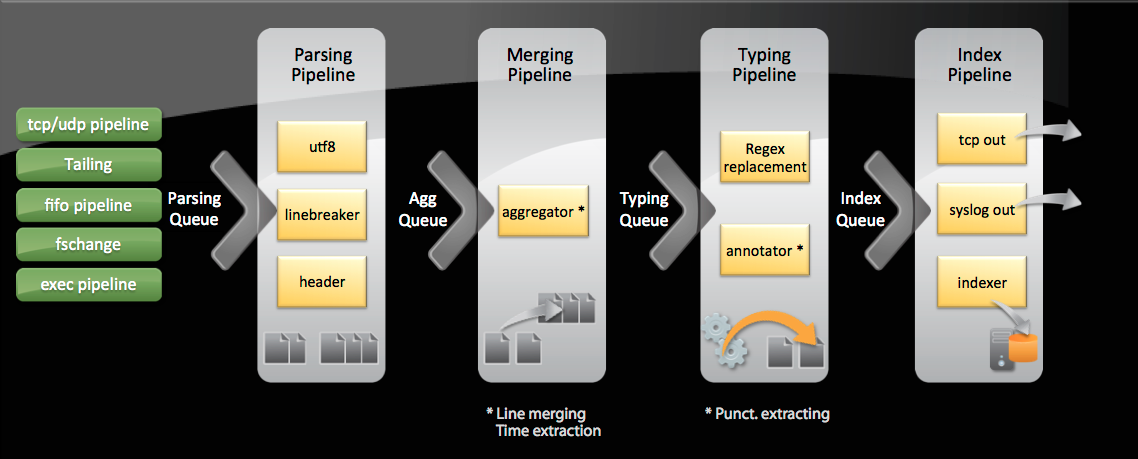
Image courtesy of the Splunk on Splunk App
I was a recent attendee of Splunk’s worldwide user’s conference .conf 2012. It was held at the ultra modern and chic Cosmopolitan Hotel located in the heart of Las Vegas, Nevada. Over 1000 people attended the conference and there were 90+ information sessions geared towards a wide range of Splunk user levels. At any given moment over the 3-day conference, there were 12-16 sessions going on at the same time. There was literally a world of knowledge being handed out to anyone who would listen. Speaking of “handed out”, Splunk gave every attendee the new “Exploring Splunk” book by David Carasso and a very stylish hooded sweatshirt! Gotta love high quality conference schwag!!
One of the sessions I found particularly interesting was “How Splunkd Works” by Amrit Bath, Splunk Director of Input Operations, and Jagaannath Keraj, Splunk Senior Software Engineer. They reviewed Splunk’s data input queues and how to troubleshoot your Splunk environment using metrics.log if you run into any issues pertaining to those queues.
The four major queues in the data input pipeline are parsing, merging, typing, and index. Data flows through the queues in the following order and each one contains different processes that take place within them.
- Parsing queue
- UTF-8 – character encoding
- Line Breaker – breaks down the events into separate lines
- Header – rewrites index-time fields if prompted
- Merging queue
- Aggregator – includes line merging and time stamp extraction
- Typing queue
- Regex replacement – performs any regular expression replacements called on in props.conf/tranforms.conf
- Annotator – extracts the punct field
- Index queue
- TCP/Syslog out – sends data to a remote server
- Indexer – writes the data to disk
If you find that you are having lag issues with your data or issues with data just not showing up on your indexer, one of the above queues could be blocked. Take a look at metrics.log which is located in the $SPLUNK_HOME/var/log/splunk directory. There is a wealth of information in metrics.log that you can use to troubleshoot various issues such as forwarding throughput and slow searches. We will concentrate on blocked queues for this blog, but maybe in the future I will write another one about the other information located in metrics.log.
Run the following search, replacing <server> with the name or IP of the server you want to query, to see if any queues are indeed blocked:
[framed_box width="700" height="15" ]
index=_internal host=<server> source=*metrics.log group=queue “blocked”
[/framed_box] If this search returns results the queue that is blocked will show up in the “name” field. Multiple queues can be filled at the same time but you should always start troubleshooting the queue that is most downstream. Meaning, if you see that the parsing and merging queues are full but the typing and index queues are not, you should start with taking a closer look at the merging queue.
When troubleshooting a blocked queue you should look into the processes that are running in that queue. The merging queue contains the aggregator process. Run the following search, again, replacing <server> with the name or IP of the server you want to query, to see how much CPU each process is using:
[framed_box width="700" height="15" ]
index=_internal host=<server> source=*metrics.log group=pipeline | timechart span=1h sum(cpu_seconds) by processor
[/framed_box] View the results of this search as a stacked column chart to see how much CPU is being used by the aggregator process compared to the others. Fine tune your line merging and time extractions settings in props.conf to help Splunk run faster. Take a look at my previous blog for more information about those attributes in props.conf.
I was on a client site recently who was experiencing huge lag with data being indexed. Using the information I learned at .conf 2012 I was able to successfully speed up their Splunk environment and unblock all of the blocked queues. I also suggested that they regularly monitor their queues using the Splunk on Splunk App. (http://splunk-base.splunk.com/apps/29008/sos-splunk-on-splunk) This app contains a dashboard called “Indexing Performance” that includes panels that include the searches above and show all queues and processors running in your environment. It is a great way to keep an eye on your environment’s performance. There are multiple other dashboards that are extremely useful in auditing and monitoring your Splunk environment. Check it out when you get a chance, it will be worth it, I promise.
The information you receive and the knowledge you gain at the Splunk user conference is invaluable and can be directly transferred to the real world. The save the date for .conf 2013 has already gone out: http://www.splunk.com/goto/conf. I hope to see you there!
- Log in to post comments
