UID UID, where art thou my UID

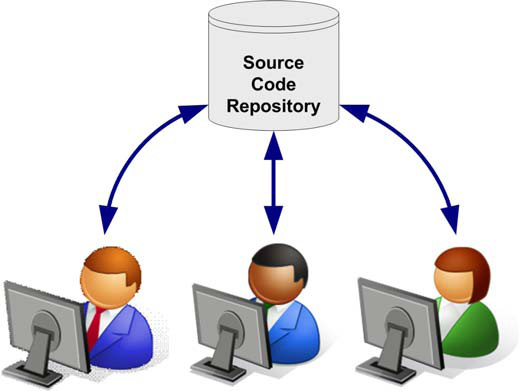
My Import for a UID! No, for ‘twas not so simple.  To understand this story we must begin a few versions ago when a tool now known as WebCenter Sites Developer Tools (WSDT) was introduced to finally allow I.T. teams to manage their WebCenter Sites Artifacts within a source code repository such as GIT, BitBucket or SVN.  These artifacts were not just code related, but also content related.  

In addition to enabling the creation of local environments for Developers to truly allow them to encapsulate their work, this tool also opened new avenues for content migration and allowed I.T....


Growing your Splunk Deployment

Intro

Growth.  It's important in so many aspects of our lives; from our careers, health, and relationships.  The famed motivational, self-help guru Tony Robbins says that beyond our basic needs, we need growth and giving back in order to truly be fulfilled.  In addition to adding to ourselves, sometimes growth requires us to rebuild a portion of ourselves.  Well, Splunk is no different.  In order for it to keep it's self-esteem high, it also needs to grow. In this blog post I wanted to cover a process to expand the number of indexers in an existing Splunk deployment while also rebuilding...


Splunk 6.5 Under the Hood: Clustering Enhancements

Intro

By now I’m sure you’ve heard about the release of Splunk Enterprise 6.5. Those of you who were at .conf 2016 got to see many of the new features during the keynotes, in sessions, and at the various booths.

Splunk Enterprise 6.5 brings lots of great enhancements related to user experience such as table datasets, conditional table formatting, dashboard editing, and enhanced search/SPL assistance. For those of you who have not had a chance to see some of the new features yet, I encourage you to check out this short video: ...


Enhance your WCS Dashboard Widgets with D3.js

As far back as I can remember, WebCenter Sites' Contributor UI dashboard widgets have been simple HTML tables full of text. Behold, D3.js, a JavaScript library that helps "bring your data to life" and easily create animated graphics. 

A good use case for this is the two dashboard widgets that come with Function1's LingoTek inside WebCenter Sites product (pictured below), which simply show some numbers about recent activity between WCS and Lingotek.


These widgets work just fine. But with D3, we can convert them into bar charts that are much easier to...


Stay In Touch