Using C3.js to Create a Custom Visualization in Splunk

Introduction
Data visualizations in Splunk are an extremely powerful way to analyze and derive value from the mountains of data collected every day. Today, I’d like to cover how to create a custom visualization in Splunk using the C3.js library, which is built on top of the extremely popular and powerful D3.js data visualization library. One of the advantages of using C3 is that the syntax is somewhat simpler to use than D3. While “D3” stands for “Data-drive Documents,” “C3” stands for “Comfortable, Customizable, and Controllable.”
The sample in this post builds off the Splunk tutorial for creating a custom visualization, especially part 6 related to using a third-party visualization. You can follow the tutorial and then in step 6 try the code in this post to create your visualization using C3.
Setting Up
In order to use the C3 library, you’ll have to install both D3 and C3 in your Splunk app. In this example, we’re using the “d3.js” and “c3.js” files and have installed them in the app’s “appserver/static” directory.
/Applications/Splunk/etc/apps/customviewtutorial/appserver/static
-rw-r--r--  1 Anshu  wheel   359K Apr  9 20:19 c3.js
-r--r--r--@ 1 Anshu  wheel   330K May  4  2016 d3.js
The End Goal
The screenshot below shows the custom visualization that we will end up with:
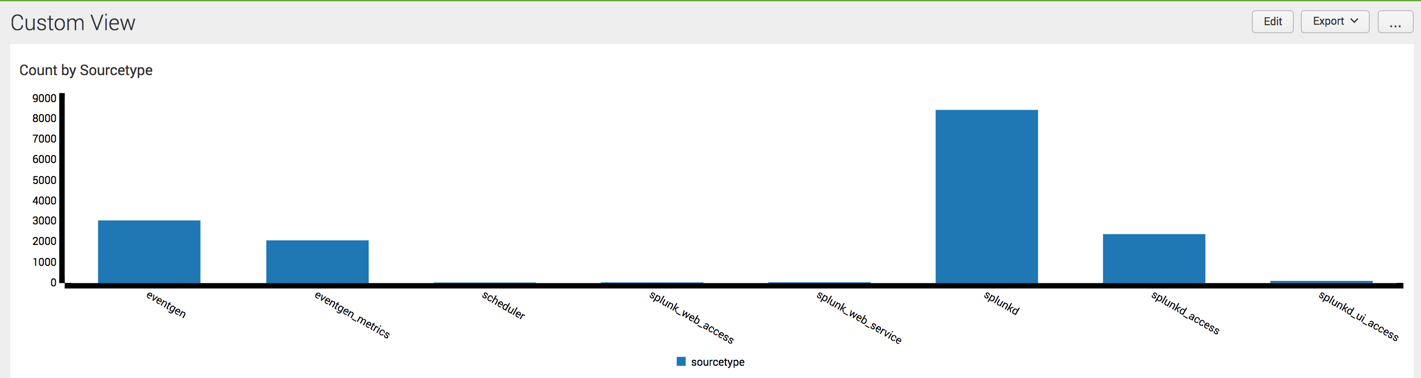
It’s nothing too fancy. It's a simple bar chart that shows the count of sourcetypes from a Splunk instance’s _internal index; however, by using the template provided here and exploring the C3.js API, you can start creating and enhancing your own visualizations.
Creating and Enhancing the View
Other than the D3 and C3 libraries, there’re three main files in play here:
- Custom_view.xml – This is the Splunk view that’s hosting the custom visualization and calls customview.js
- Customview.js – This is the javascript file which instantiates the demoview module
- Demoview.js – This is the javascript file that defines the module for the custom visualization
We’ll paste the code and then highlight a few points about each file. Please note that the .js files contain comments to help explain what is going on in the code.
---custom_view.xml---
<dashboard script="customview.js">
  <label>Custom View</label>
  <row>
    <html>
      <h2>Count by Sourcetype</h2>
      <div id="mycustomview"></div>
    </html>
  </row>
</dashboard>
For those familiar with Splunk views, you’ll recognize the SimpleXML syntax here. This is an extremely simple Splunk dashboard. Note that it references the “customview.js” script and contains a div inside of an html element called “mycustomview.” This div ID will be important as it will be used bind to in the view scripts.
---customview.js---
/* customview.js */
require([
    "/static/app/customviewtutorial/demoview.js",
    "splunkjs/mvc/searchmanager",
    "splunkjs/mvc/simplexml/ready!"
], function(DemoView, SearchManager) {

    var mySearch = new SearchManager({
        id: "mysearch",
        preview: true,
        cache: true,
        search: "index=_internal earliest=-1h | stats count by sourcetype"
    });

    var customView = new DemoView({
        id: "mycustomview",
        managerid: "mysearch",
        el: $("#mycustomview")
    }).render();
});
As stated above, customview.js is referenced from the Splunk view and instantiates the view module. A few things to note:
- In the “require” statement at the top, it loads the “demoview” module, as well as other components such as the Splunk search manager. They are referenced in the function as “DemoView” and “SearchManager,” respectively.
- A “SearchManager” object is created, which contains the Splunk search which will power the custom visualization. A simple search here is used for example purposes.
- A “DemoView” object is created, which contains the visualization and then calls the “render” function to display it.
---demoview.js---
//This configuration is required to ensure that c3 can find d3 when it is initializing
requirejs.config({
    paths: {
        "d3": "/static/app/customviewtutorial/d3",
        "c3": "/static/app/customviewtutorial/c3",
    }
})

define(function(require, exports, module){

    // Base class for custom views
    var SimpleSplunkView = require('splunkjs/mvc/simplesplunkview');

    // Require Underscore.js to work with search results
    var _ = require("underscore");

    //Require d3 and c3 libraries to produce custom data visualizations
    var d3 = require("d3");
    var c3 = require("c3");

    // Define the custom view class
    var DemoView = SimpleSplunkView.extend({

        className: "demoview",

        // Define our initial values, set the type of results to return
        options: {
            data: "results"  // Results type
        },

        // Override this method to configure the view
        createView: function() {
            return this;
        },

        // Override this method to format the data for the bar chart
        formatData: function(data) {

            //Array to store the series data for the visualization
            var seriesDataArray = ['sourcetype'];

            //Array to store the x tick values
            var xTickValuesArray = [];

            //Iterate through the result set and add elements of the result set to the appropriate list
            _.each(data, function(row, i){
                seriesDataArray.push(row[1]);
                xTickValuesArray.push(row[0]);
            });

            //Object to hold the data for the visualization
            var chartData = {
                seriesData: [
                    seriesDataArray
                ],
                xTickValues: xTickValuesArray
            }
            return chartData;
        },

        // Override this method to put the Splunk data into the view
        updateView: function(viz, chartData) {

            //create the chart object using the c3 generate function
            var chart = c3.generate({

                //The div ID from the Splunk view
                bindto: '#mycustomview',
                data: {
                    //The data for the series, in this case the count of each sourcetype
                    columns: chartData.seriesData,

                    //Create a bar chart from the “sourcetype” data series
                    types: {
                        sourcetype: 'bar'
                    }
                },

                axis: {
                    x: {
                        //Setting the type of the x-axis
                        type: 'category',

                        //Setting the x-axis labels
                        categories: chartData.xTickValues,

                        //rotating the x-axis labels by 30 to better accommodate the length of
                        //some of the labels

                        tick: {
                            rotate: 30
                        }
                    }
                }
            });
        }
    });

    return DemoView;

});
The demoview.js file is where all the fun happens. This is where the custom visualization module is defined. Let’s go through this file in some detail.
First, you’ll note at the top of the file that there is requirejs config to name paths for “d3” and “c3.” As the comment states, this is needed so that C3 can find D3 when it is initializing. Without this configuration, “c3” will be “undefined” in the code and references to the library will not work.
---from demoview.js---
//This configuration is required to ensure that c3 can find d3 when it is initializing
requirejs.config({
    paths: {
        "d3": "/static/app/customviewtutorial/d3",
        "c3": "/static/app/customviewtutorial/c3",
    }
})
Next you’ll notice that the define function call is a simplied CommonJS wrapper. This approach in RequireJS allows you to author your module as if it were a CommonJS module. With this approach, dependencies are loaded via “require” statements in the script, such as:
---from demoview.js---
    // Base class for custom views
    var SimpleSplunkView = require('splunkjs/mvc/simplesplunkview');

    // Require Underscore.js to work with search results
    var _ = require("underscore");

    //Require d3 and c3 libraries to produce custom data visualizations
    var d3 = require("d3");
    var c3 = require("c3");
In the following line, we extend the SimpleSplunkView to create our DemoView object:
---from demoview.js---
var DemoView = SimpleSplunkView.extend({Two of the main functions we’ll override are “formatData” and “updateView.”
In “formatData,” we’ll iterate through the result set of the Splunk search to create two lists:
- “seriesDataArray” - which stores the count of the sourcetypes
- “xTickValuesArray” - which will store the list of sourcetypes
Both of these lists are then used to populate a “chartData” object, which will be used in the “updateView” function. Note that in the chartData object below, the “seriesData” element is a 2-dimensional array, even though we’re only passing in one data series list. This is needed because the C3 chart expects a 2-dimensional array for the “data.columns” property; one array per data series.
---from demoview.js---
            //Object to hold the data for the visualization
            var chartData = {
                seriesData: [
                    seriesDataArray
                ],
                xTickValues: xTickValuesArray
            }
Finally, we get to our “updateView” function, which actually uses the C3 code. Comments are in-line to explain what each piece is doing.
---from demoview.js---
        // Override this method to put the Splunk data into the view
        updateView: function(viz, chartData) {

            //create the chart object using the c3 generate function
            var chart = c3.generate({

                //The div ID from the Splunk view
                bindto: '#mycustomview',
                data: {
                    //The data for the series, in this case the count of each sourcetype
                    columns: chartData.seriesData,

                    //Create a bar chart from the “sourcetype” data series
                    types: {
                        sourcetype: 'bar'
                    }
                },

                axis: {
                    x: {
                        //Setting the type of the x-axis
                        type: 'category',

                        //Setting the x-axis labels
                        categories: chartData.xTickValues,

                        //rotating the x-axis labels by 30 to better accommodate the length of
                        //some of the labels
                        tick: {
                            rotate: 30
                        }
                    }
                }
            });
        }
    });
For those that have used D3 to create visualizations, you'll note that the C3 syntax used here is pretty minimal in comparison. The challenge, if you choose to accept it, is to enhance the visualization above or create your own visualization by referencing the C3.js API: http://c3js.org/reference.html.
Conclusion
C3 is another third-party visualization library that can simplify the process of creating custom visualizations in Splunk. I hope this post has helped familiarize how to use this library in creating a custom Splunk view. Thanks for reading and, as always, happy Splunking!
- Log in to post comments
