Creating a Custom D3 Application with Visualizations in Splunk
This is a slightly lengthy tutorial on creating your own D3 (or any other open source JavaScript library) visualization and app for use in Splunk. It assumes familiarity with creating Splunk Apps, as well as with JavaScript, and as such is at a more intermediate level: before creating this app, you might want to work on both your JavaScript skills and work on creating some Splunk visualizations with Splunk JS or Simple XML. You should also familiarize yourself with the code for the existing D3 visualizations in splunk so you can be ready to create new ones.
(UPDATE: A newer version of the code can be found here. It now inlcudes basic error handling, and also has been changed from "gauge" to "meter" to avoid confusion with Splunk's built-in "radial gauge" visualization.)
First Things First: Using Development Mode
Before we even start developing, it's really helpful to put your system into development mode. Doing this requires adding the following stanza to /etc/system/local/web.conf:
[settings]
minify_js = False
minify_css = False
js_no_cache = True
cacheEntriesLimit = 0
cacheBytesLimit = 0
enableWebDebug = True
(Also, if the file doesn't currently exist, create it in that location then add that stanza.) One of the reasons we are doing this is so that we can view changes as they're made by preventing any web caching; i.e. you don't need to clear your cache in order to see if your updates. We also are enabling debugging because of course we are!
Building an App
There are two ways to create the necessary directory structure for the app:
- You can download it from Splunk here, being careful to rename any directories and files that need renaming.
- You can create the directory structure and files yourself.
(You could also add it to an existing app if you want to.) Make sure to create the file structure below in /etc/apps/:
<appname>
    appserver
        static
            visualizations
                <visualization_name>
                    src
                        visualization_source.js
                    webpack.config.js
                    visualization.js
                    visualization.css
                    formatter.html
                    package.json
                    preview.png
    default
        visualizations.conf
        savedsearches.conf
    metadata
        default.meta
    README
        savedsearches.conf.spec
Above in bold are the files that we will be editing, and the directory name for <visualization_name> is whatever you want to call your visualization, just like <appname> is what you'd like to call your app. (This is how you can add multiple visualizations to any app, taking care to name each visualization separately, and to edit the appropriate js and style files in each.) All we need to do to get started is to jump into terminal, rename the <visualization> directory to "radial_meter" and start setting up our dependencies, pulling in our libraries.
- From the /appname/appserver/static/visualizations/radial_meter (or whatever you want to call your visualization) directory, run: $ npm install, which will create a directory for the dependencies we're about to add.
- From the same directory, run $ npm install --save d3, which will create a d3 directory in /node_modules
- From the same directory, run $ npm install --save jquery
- From the same directory, run $ npm install --save underscore
So, now let's fire up Atom and get to it! (I guess you can use Sublime or TextWrangler if you want to, though. If you like to live life in super hardcore mode, type in vi. If you hate your life and everything having to do with it, open up emacs. I understand: some of you just want to watch the world burn.)
Creating the basics of visualization_source.js (everything but the updateView function)
Right now, you're either staring at the default codeblock provided by Splunk, or a blank screen. What we need to do is make sure that we (1) set the dependencies correctly, (2) initialize our visualization, and (3) provide a CSS selector for our function. So, by either adding the necessary changes or just replaing the file with what we have below, the file should look like this:
define([
            'jquery',
            'underscore',
            'vizapi/SplunkVisualizationBase',
            'vizapi/SplunkVisualizationUtils',
            'd3'
        ],
        function(
            $,
            _,
            SplunkVisualizationBase,
            SplunkVisualizationUtils,
            d3
        ) {

    return SplunkVisualizationBase.extend({

        initialize: function() {
            this.$el = $(this.el);

            // Add a css selector class
            this.$el.addClass('splunk-radial-meter');
        },

        getInitialDataParams: function() {
            return ({
                outputMode: SplunkVisualizationBase.ROW_MAJOR_OUTPUT_MODE,
                count: 10000
            });
        },

        updateView: function(data, config) {

        }
    });
});
Now it's time to move along to writing the updateView function, which is the heart of the visualization: it's how we draw it.
Creating the updateView function
(If you want to know specifically why we're writing the code this way and how UpdateView works in extending the SplunkVisualizationBase app, a detailed discussion is available in the Splunk Docs here.)
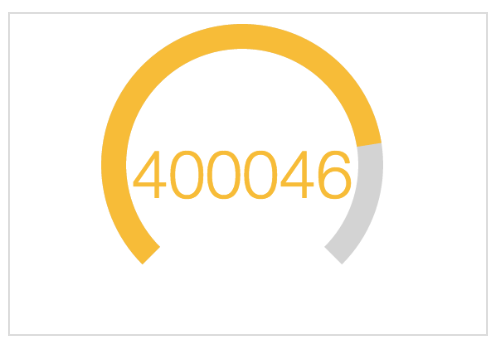
There are other radial meters out there, and this code borrows setup options from a couple of them. What we need our function to do is: (1) to make sure that it doesn't freeze if there's no data, (2) initialize it with the first data point, (3) setup our SVG, (4) setup the arc, (5) draw the arcs, (6) fill the arcs, and (7) place text to show the gauge readings. It should end up looking something like this:
       updateView: function(data, config) {


            // Check for empty data
            if(data.rows.length < 1){
                return;
            }
            // Take the first data point
            datum = data.rows[0][0];
            // Clear the div
            this.$el.empty();

            // Pick colors and value
            var mainColor = 'green';
            var maxValue = 100;

            // Set height and width
            var height = 220;
            var width = 220;

            // Create a radial scale representing 75% of a circle
            var scale = d3.scale.linear()
                .domain([0, maxValue])
                .range([ - Math.PI * 0.75, Math.PI * 0.75])
                .clamp(true);

            // Define arc
            var arc = d3.svg.arc()
                .startAngle(function(d){
                    return scale(0);
                })
                .endAngle(function(d){
                    return scale(d);
                })
                .innerRadius(70)
                .outerRadius(85);

            // SVG setup
            var svg  = d3.select(this.el).append('svg')
                .attr('width', width)
                .attr('height', height)
                .style('background', 'white')
                .append('g')
                .attr('transform', 'translate(' + width / 2 + ',' + height / 2 + ')');

            // Background arc
            svg.append('path')
                .datum(maxValue)
                .attr('d', arc)
                .style('fill', 'lightgray');

            // Fill arc
            svg.append('path')
                .datum(datum)
                .attr('d', arc)
                .style('fill', mainColor);

            // Text
            svg.append('text')
                .datum(datum)
                .attr('class', 'meter-center-text')
                .style('text-anchor', 'middle')
                .style('fill', mainColor)
                .text(function(d){
                    return parseFloat(d);
                })
                .attr('transform', 'translate(' + 0 + ',' + 20 + ')');

        }
    });
Obviously, your programming style may vary, but so long as it does what the above does, you're on the right track, and we're done with this file for now.
CSS Styles
Hop over to the visualization.css file in the /appserver/static/visualizations/radial_meter/ directory. Here, we want to make sure that we have the text large enough to be seen, and the gauge in the middle of the screen. Your mileage may vary on both appropriate font size and desired SVG placement, but for now, you should see something like this:
.meter-center-text {
     font-size: 50px;
     font-weight: 200;
     font-family: "Helvetica Neue", Helvetica, sans-serif;
 }

 /* Center the SVG */
 .splunk-radial-meter svg {
     display: block;
     margin: auto;
 }
That wasn't so bad, right?
Visualizations.conf
Now it's time to make sure that Splunk knows the visualization exists by editing the visualizations.conf file in the /default directory. If you're using the Splunk tutorial app, you will see a stanza called "standin" that you need to delete, as it's a stand-in stanza for visualizations. Otherwise, you're going to need to add your own stanza to a blank file. Let's put in our own visualization:
[radial_meter]
label = Radial Meter
description = "This is our radial meter visualization."
Export the visualization for use in other apps
If you want to use this in other apps in your Splunk instance, you need to add it to the default.meta file in the /metadata folder. Again, if you're using the Splunk tutorial app, you need to delete/uncomment the stand-in stanza, and replace it with a stanza that has your own visualization's correct path:
[visualizations/radial_meter]
export = system
Use the Visualization
Now that we've programmed the visualization, we need to build it by typing $ npm run build in the /appserver/static/visualizations/radial_meter folder. Once it's built, fire up Splunk, and since we exported the visualization globally, it will appear as an option for visualization even from the Search and Reporting App.
Keep Going
While this is a quick app to create, there are still many more things we can do to make our apps more powerful, including advanced error handling (so we throw errors instead of crashing), naming properties (so we have a color attribute that may default to green, but can be changed as a property by the user in dashboard options), or using a format menu in formatter.html (where inputs can be created to let the user input property values). And we haven't even mentioned using a custom API to add so many more features to your apps. Happy Splunking, all!
- Log in to post comments
