Stepping Up with Splunk!

“Surround yourself with the dreamers and the doers, the believers and thinkers, but most of all, surround yourself with those who see greatness within you, even when you don’t see it in yourself.” –Edmund Lee


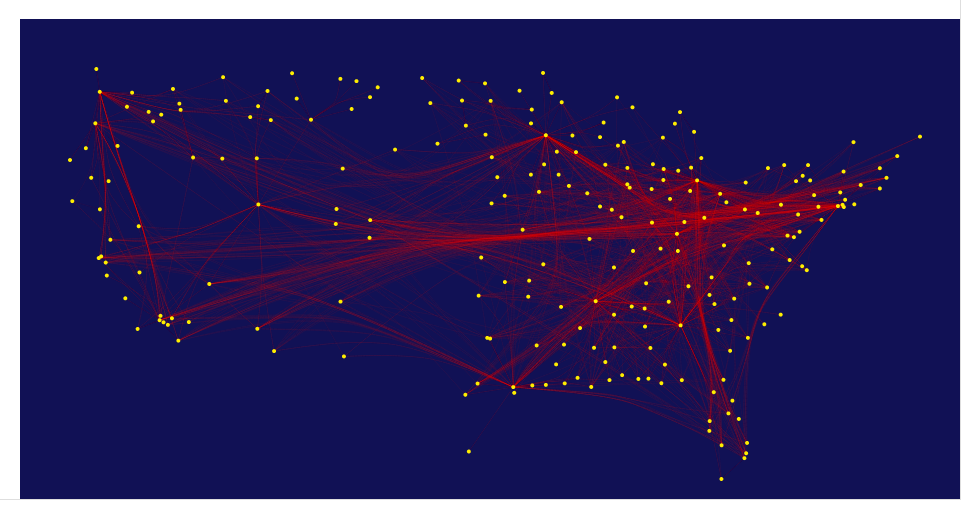
Splunk is an extremely versatile application, dissecting everything from a small csv file to multiple terabytes of data. I am a member of Function1’s Wellness Team as well as a part of the OI Practice. This year, the Wellness Team has decided to revamp itself and I thought Splunk would be a great tool to utilize to track our progress and feedback from...


Splunk, Now You See Me, Now you Don't!

Splunk allows customers the flexibility to create their own visualizations. While at a customer we created a cool way to hide and have panels pop up when you click on a single panel. All of these searches are internal so you can test on your Splunk Instance, and then change it to your desired results!


The Simple XML will look something like this: 


<dashboard script="example_single_panel_inline_drilldown.js">

<label>Single panel inline drilldown</label>

<row...
          

Adding D3 Visualizations to Splunk Dashboards

Introduction

In this post I would like to cover how to add some really great visualizations to a dashboard in Splunk.  I will cover how to use D3.js, a third-party javascript visualization library, and Splunk's JS stack. 

D3.js (or just D3 for Data-Driven Documents) is a “JavaScript library that uses digital data to drive the...


Stay In Touch