Adding D3 Visualizations to Splunk Dashboards
Introduction
In this post I would like to cover how to add some really great visualizations to a dashboard in Splunk. I will cover how to use D3.js, a third-party javascript visualization library, and Splunk's JS stack.
D3.js (or just D3 for Data-Driven Documents) is a “JavaScript library that uses digital data to drive the creation and control of dynamic and interactive graphical forms which run in web browsers." (http://d3js.org/) In this post we'll cover how to add a D3ChartView control to a Splunk dashboard.
D3ChartView has several charts to choose from depending on your analysis and needs. These charts are highly configurable and move away from the standard cookie cutter solutions. The following is a list of charts available in the D3 library.
- Bullet: "bulletChart"
- Cumulative Line: "cumulativeLineChart"
- Discrete Bar: "discreteBarChart"
- Horizontal Multi Bar: "multiBarHorizontalChart"
- Line Plus Bar: "linePlusBarChart"
- Line with View Finder: "lineWithFocusChart"
- Pie: "pieChart"
- Scatter/Bubble: "scatterChart"
- Simple Line: "lineChart"
- Stacked Area: “stackedAreaChart"
- Stacked Multi-Bar: "multiBarChart"
Adding a D3 Chart
The following is a step-by-step process to include a D3ChartView (D3 Visualization) to a Splunk Simple XML dashboard.
1. Create the App through the CLI:
- Creating the app through the CLI will create additional directories allowing you to expand using the Web Framework in the future.
-
Run the following command on the command line. Replace "your_app_name" with the name of your app.
$SPLUNK_HOME/etc/apps/framework/splunkdj createapp your_app_name-
Restart Splunk
2. Create and save dashboard in app:
-
Click the newly created app on the Splunk home page or click Apps->Manage Apps
-
Enter search string in Search Bar ex. index=_internal | head 100 | stats count by source
-
Click Save As in the upper right hand corner, choose Dashboard Panel and enter information
-
Click save
-
Click view dashboard
-
Click the Edit dropdown list located in the upper right hand corner
-
Click the Edit Source button
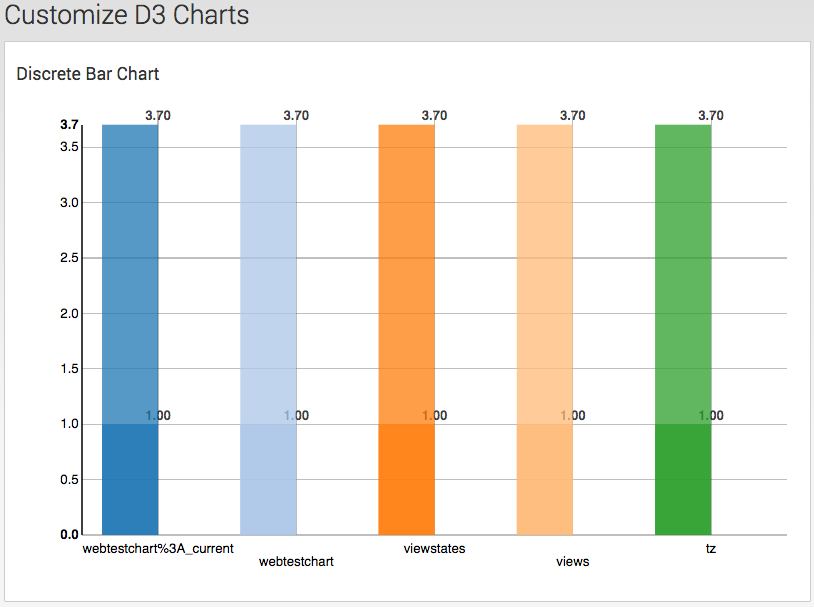
The following is a Simple XML form embedded with a D3 graph including a Javascript file.
Code example #1
<dashboard script="custom_chart.js" stylesheet="custom_chart.css">

<label>Customize D3 Charts</label>

<row>

    <html>

        <h2>Discrete Bar Chart</h2>

        <div id="chart1" />

    </html>

    <table id="table1">

 <searchString>index=_internal | head 100 | stats count by source</searchString>

      <earliestTime></earliestTime>

        <latestTime></latestTime>

    </table>

</row>

</dashboard>

<dashboard script="custom_chart.js "stylesheet="custom_chart.css">

<label>Customize D3 Charts</label>

  <html>

        <h2>Discrete Bar Chart</h2>

        <div id="chart1" />

    </html>

<table id="table1">
- Copy the above code under code sample #1 and save in a file somefilename.html
- Copy the code example #2 below and save somejsfilenaname.js in $SPLUNK_HOME/etc/apps/app_name/appserver/static
- Note: create any directories if one does not exist.
- Load Libraries: Include file paths within the brackets. If using another D3 package other than NVD3.js, add the path here.
Code example #2
require([

'underscore',

'jquery',

'splunkjs/mvc/utils',

'splunkjs/mvc',

'splunkjs/mvc/d3chart/d3chartview',

'util/moment',

'splunkjs/mvc/simplexml/ready!'

], function(_, $, utils, mvc, D3ChartView, moment) {

// Re-use the search manager of the results table

var tableManagerid = mvc.Components.get('table1').settings.get('managerid');

// Create the D3 chart view

    var chart = new D3ChartView({

       "id": "chart1",

    "type": "discreteBarChart",

    "data": "preview",

    "managerid": tableManagerid,

          “setup”: function(chart) {

    // Configure chart formatting

    chart.showValues(true);},

    "el": $('#chart1')

}).render();

});
Conclusion
This example is only a template to call D3ChartView from a SimpleXML dashboard. There are many other enhancements or styles that can be added via the CSS file, i.e. Splunk Dashboard Style (Layout) to enhance the user experience.
Additional Information
Splunk Web Framework and NV D3 charts: http://dev.splunk.com/view/webframework/SP-CAAAER6
NVD3 charts: www.nvd3.org
Thanks for reading!
- Log in to post comments
