Investigating Sites Tables in R

A very common theme is being asked to do some analysis on a WebCenter Sites installation but not having direct access to the system.
In this blog we will show you how you can take simple Sites Explorer or Catalog Mover exports and interrogate them in R.
If you are not familiar with R you can find more information at https://www.r-project.org/. Basically it is a statistical programing language which does many things like you would do in Excel except programatically.
First we load up the XML library to process the html files:
library(XML)
Now lets open up the AssetPublication table from the zip file and read in the data to a "DataFrame". A DataFrame is one of the base units of R and similar to a worksheet in excel with rows and columns.
# create an object pointing to the file in the zip we want to process
f <- unz("AssetPublication.zip", "AssetPublication.html")

# read all of text and pass it to the readHTMLTable function
t <- readHTMLTable(readLines(f))

# The output of readHTMLTable will be a list with each table in the file as an element.  We want the AssetPublication table
assetPublication <- t$AssetPublication

close(f)


head(assetPublication)
## id pubid assettype assetid ## 1 1 1112198287026 Media_A 1112195133863 ## 2 10 1112198287026 Media_A 1112195133923 ## 3 11 1112198287026 Media_A 1112195133928 ## 4 1112192431361 1112198287026 Content_A 1112192431358 ## 5 1112192431366 1112198287026 Content_A 1112192431363 ## 6 1112192431371 1112198287026 Content_A 1112192431368
So now we have the AssetPublication table. Lets have a look at the asset counts.
table(assetPublication$assettype)
##
##          AdvCols  ArticleCategory        AttrTypes       AVIArticle
##               15                6               13              136
##         AVIImage        Content_A        Content_C       Content_CD
##              249               13               13                1
##        Content_F        Content_P       Content_PD ContentAttribute
##                2                1                1               24
##       ContentDef ContentParentDef        CSElement           Device
##                3                1               46               25
##      DeviceGroup        Dimension     DimensionSet       Document_A
##               11                4                1               10
##       Document_C      Document_CD       Document_F       Document_P
##               35                1                3                4
##      Document_PD      FSIIVisitor  FSIIVisitorAttr   FSIIVisitorDef
##                1                2               11                1
##   FW_Application          FW_View    ImageCategory          Media_A
##                5                5               11               11
##          Media_C         Media_CD          Media_F          Media_P
##               27                1                3                3
##         Media_PD             Page    PageAttribute   PageDefinition
##                1               30               18                9
##        Product_A        Product_C       Product_CD        Product_F
##               15               17                1                4
##        Product_P       Product_PD       Promotions       ScalarVals
##               20                4                1               12
##         Segments        SiteEntry         SitePlan            Slots
##                3                9                4               17
##       StyleSheet         Template          WebRoot          YouTube
##               10              139                3                5
Well that isn't very pretty. We can use the dplyr package to get some easy to use functions to process the data.
Lets find the top 10 asset types in this table:
library(dplyr)
assetPublication %>% count(assettype, sort=TRUE) %>% top_n(10)
## Source: local data frame [10 x 2]
##
##           assettype     n
##              (fctr) (int)
## 1          AVIImage   249
## 2          Template   139
## 3        AVIArticle   136
## 4         CSElement    46
## 5        Document_C    35
## 6              Page    30
## 7           Media_C    27
## 8            Device    25
## 9  ContentAttribute    24
## 10        Product_P    20
What if we want to break that down by site? We probably want to include the names out of the publication table.
publication <-  readHTMLTable(readLines(unz("Publication.zip", "Publication.html")))$Publication
assetPublicationWithNames <- assetPublication %>% inner_join(publication, c("pubid"="id"))
assetPublicationWithNames %>% group_by(name, assettype) %>% tally(sort = TRUE) %>% top_n(5)
## Source: local data frame [12 x 3]
## Groups: name [3]
##
##           name        assettype     n
##         (fctr)           (fctr) (int)
## 1    AdminSite   FW_Application     5
## 2    AdminSite          FW_View     5
## 3    avisports         AVIImage   249
## 4    avisports       AVIArticle   136
## 5    avisports         Template    91
## 6    avisports ContentAttribute    24
## 7    avisports        CSElement    21
## 8  FirstSiteII         Template    48
## 9  FirstSiteII       Document_C    35
## 10 FirstSiteII          Media_C    27
## 11 FirstSiteII        CSElement    25
## 12 FirstSiteII        Product_P    20
As one final example lets look at the number of assets per site.
aps <- assetPublicationWithNames %>% group_by(name) %>% tally() %>% arrange(n)
pie(aps$n, labels = aps$name, col = rainbow(length(aps$n)))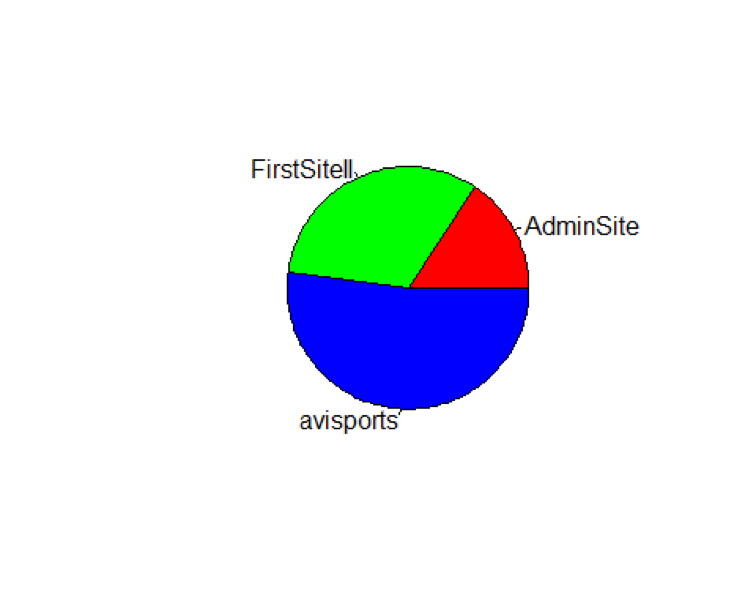
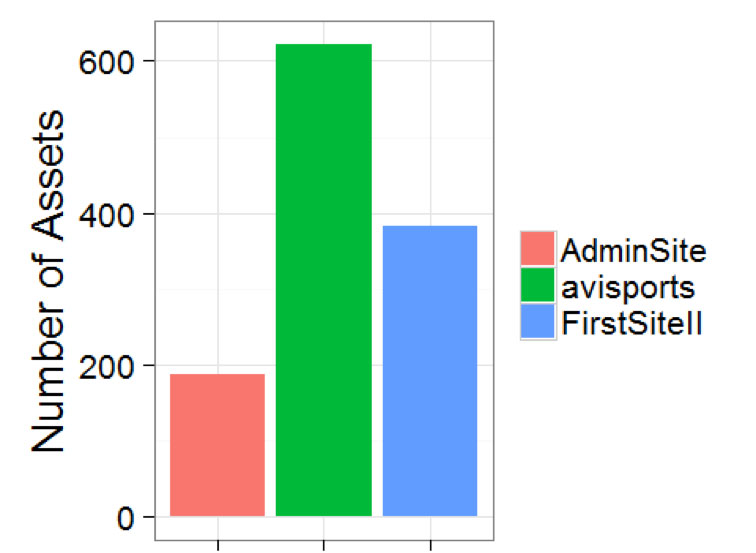
Or as a bar chart
library(ggplot2)
  ggplot(aps, aes(x=name, y=n, fill=name)) +
  geom_bar(stat="identity") +
  theme_bw(base_size = 20) +
  ylab("Number of Assets") +
  theme(axis.title.x = element_blank()) +
  guides(fill=guide_legend(title=NULL))
- Log in to post comments

Comments
Philip Gleghorn on November 02, 2016
Very nice! :)