Getting a Pulse on Your System: How to Build a System Health Indicator in Splunk
Welcome Splunkers! I hope everyone is having a great New Year. We certainly are, here at Function1. We just publicly released a beta version of our Splunk for Oracle WebLogic Server app to Splunkbase as mentioned in a recent post. As part of the Splunk products team at Function1, I'm always looking at new ideas and approaches in Splunk app development. As Splunk apps become more robust, they will inevitably become more complex in structure.
This complexity brings about the need to think more deeply about application architecture and design patterns in regards to building a Splunk app. In this post, I'd like to cover a requirement I recently encountered during a customer engagement. I'll identify the problem and then walk through the approach of building a solution.
The customer came up with an excellent idea to build a dashboard showing health indicators for different tiers in their enterprise system, such as application, database, network, and storage over a period of time. This is a great use case for Splunk which, amongst many things, aims to provide monitoring capabilities across an entire system. Health indicators for various metrics would be displayed for each tier. A green indicator would mean "healthy", yellow would mean "caution", and red would serve to alert that the system may be in a "critical state."
As an example, let's build a system health indicator for server memory availability.
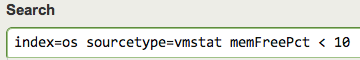
1. The first step is to define what a critical memory event is for the system. In this case, we'll say that if a server has less than 10% memory available then that indicates it's in a critical state at that moment. We'll construct the base search and test it in Splunk's search bar (in this example, we'll focus on *nix systems to keep the search less complicated, but it can be modified to include Windows metrics as well)
index=os sourcetype=vmstat memFreePct < 10
2. Now that we've limited the result set to only the events that show critical memory availability for the server, we want to format the results so that they can be fed into a Single Value module. This can be done by simply appending a stats command to the search.
index=os sourcetype=vmstat memFreePct < 10 | stats count
3. We now have a count of critical events for the time period. Let's now define a rangemap so that we can assign a severity level based on the event count. The rangemap command looks at the specified field, in this case "count", and assigns it a level based on the ranges defined for each level. For now, I've arbitrarily defined the ranges as the following: low equals 0 to 10 results. elevated equals 11 to 50 results, and severe equals 51 to 100000 (arbitrarily large number) and setting the default level to severe (this is optional). This search command will create a new field called "range" and assign it the severity level based on the event count. It's important to note that I used specific range names in the command. The reason to do this is Splunk has pre-defined CSS classes that can use these specific range names to change the color of the single value module.
index=os sourcetype=vmstat memFreePct < 10 | stats count | rangemap field=count low=0-10 elevated=11-50 severe=51-100000 default=severe
4. So now that the query has been built, we're ready to save it and throw it onto a dashboard right? Almost. Given the nature of this search we will want to be able to tune the search later on to adjust for event thresholds and range levels depending on the real world operation of the system that is being monitored. We could always go back and modify the search, but a better approach from a configuration management perspective would be to create constants for these elements so that the search syntax does not have to be modified. To do this we'll use what Splunk calls "macros." Macros are basically constant values that can be used throughout an app or across apps depending on the permission levels. In our app's local directory we'll create a file called macros.conf. This can also be done through Splunk's web UI by going to "Manager" > "Advanced search" > "Search macros" Either way works, it's just a matter of preference.
[sys_health_mem_free_threshold]
definition = 10

[sys_health_mem_free_rangemap_hour]
definition = low=0-10 elevated=11-50 severe=51-100000 default=severe
Notice that "hour" was appended to the name of the rangemap macro. The reason this was done is that different dashboards might need to be created for daily or weekly views. In these cases, the range definitions will be different depending on the time period. Another thing to note is that only the range definitions were included in the macro, as these are the only parts that will change during tuning. This prevents the rest of rangemap command from being modified accidentally.
5. Now that the macros have been created we want to add them back into the search and test. The search query now looks like:
index=os sourcetype=vmstat memFreePct < `sys_health_mem_free_threshold` | stats count | rangemap field=count `sys_health_mem_free_rangemap_hour`
The key here is that these macros can be adjusted later by simply editing the macros.conf file. No changes to UI or saved search syntax needs to occur.
6. The search is now ready to be saved. The reason to save the search and not include it in-line in our dashboard is that by saving it we can take advantage of some Splunk search features such as scheduling, report acceleration, and alerts. Given that this search runs over an hour, it may not be necessary to improve the performance of it. However, if the data set is large enough, the search could be scheduled so that saved results sets could be used to populate the indicator. Also, report acceleration, a new feature in Splunk 5, could be used to build summary data for the search that would dramatically improve the search's performance.
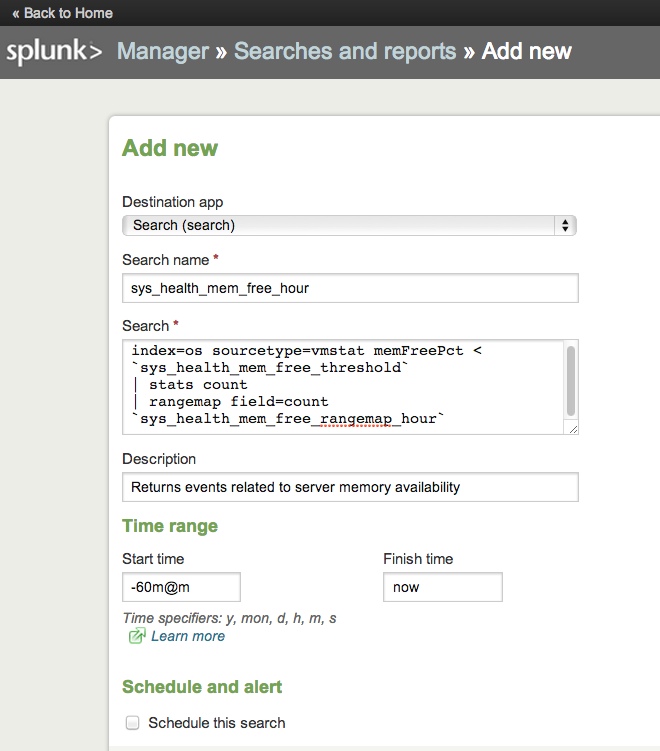
Note: Destination app would be changed to whatever the name of your app is
7. Okay now that we've saved our search, we're ready to plug it into a dashboard. The snippet below is in Splunk's advanced XML and uses a SideView utils (available on SplunkBase) SavedSearch module
<!-- Server Memory Availability Indicator -->
<module name="SavedSearch" layoutPanel="panel_row1_col1" group="System Health Memory Indicator" autoRun="True">
  <param name="name">sys_health_mem_free_hour</param>
  <param name="group">System Health Memory Indicator</param>
  <module name="SingleValue">
    <param name="linkSearch">|savedsearch "sys_health_mem_free_hour"</param>
    <param name="classField">range</param>
    <param name="beforeLabel">MEM Events</param>
    <param name="field">count</param>
    <param name="linkFields">result,afterLabel,labelafter</param>
    <param name="linkView">flashtimeline</param>
  </module> <!-- SingleValue -->
</module> <!-- SavedSearch -->
The "linkSearch" in a single value module is used to set what search is executed when the single value control is clicked. In this case, I'm setting linkSearch to the same saved search that populated the module. This can however be changed to any other saved search or valid search query. "linkView" sets which view the "linkSearch" is opened in. In this case, the linked search will be opened in the Splunk flashtimeline view.
8. After adding the code to the dashboard it should now look simlar to one of the examples below
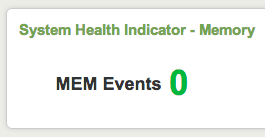

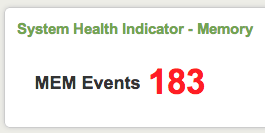
This is just one example of how to build a system health indicator for your Splunk dashboards. Other interesting variations I can think of involve changing what metric the single value control shows. For example, the search could be constructed to count by host and then the number of hosts that have more than a certain amount of events for the time period would show in the health indicator. There are many possibilities, hopefully this help provides a framework in which to implement them.
Bonus. Starting in Splunk 5, the default styles for Single Value controls in Splunk changed so that only the "value" in the single value module would change color based on level as shown above . However, if you want to change the background color of the indicator you can modify the application.css file in your app's /appserver/static directory.

Below is this the css to do this:
.SingleValue .severe {
color: white;
background-color: red;
}
.SingleValue .high {
color: white;
background-color: #ff7e00;
}
.SingleValue .elevated {
color: white;
background-color: #ffb800;
}
.SingleValue .guarded {
color: white;
background-color: #4da6df;
}
.SingleValue .low {
color: white;
background-color: #00b932;
}
.SingleValue .None {
color:white;
background-color: #999;
}
.SingleValue .severe .singleResult {
color: white;
background-color: red;
}
.SingleValue .high .singleResult {
color: white;
background-color: #ff7e00;
}
.SingleValue .elevated .singleResult {
color: white;
background-color: #ffb800;
}
.SingleValue .guarded .singleResult {
color: white;
background-color: #4da6df;
}
.SingleValue .low .singleResult {
color: white;
background-color: #00b932;
}
.SingleValue .None .singleResult {
color:white;
background-color: #999;
Thanks for reading. Cheers!
featured image courtesy of jscreationzs / FreeDigitalPhotos.net
- Log in to post comments

Comments
Omid on February 02, 2013
Usman Alizai on February 01, 2013