Splunk 7 Event Annotations and You!

If you're anything our team at Function1, you can't wait to experiment with all of Splunk 7's dynamic new features. One of these features is “Event Annotations,” a powerful tool to highlight charts. At the moment, Event Annotations can be used in time-series charts. They are relatively simple to use; all you need is a separate search on your dashboard of type=annotation, with the annotation_label defined as the field you want to show as an annotation, and the annotation_category defined as the field to group your annotations by type. There is a simple but comprehensive example in the Splunk 7 Overview detailing its capabilities. But the applications of annotated events are quite numerous!
Here is an example XML from a sample set of weather data to demonstrate how simple it is to add an annotated event to an existing chart:
<search>
  <query> source="2015 USA Weather Data FINAL.csv" host="Alexs-MBP.home" sourcetype="weather" STATION_Name'=AGATE NEBRASKA NE US" | timechart span=1d values(MaxTemp)</query>
</search>
<search> type="annotation">
  <query> source="2015 USA Weather Data FINAL.csv" host="Alexs-MBP.home" sourcetype="weather" STATION_NAME="AGATE NEBRASKA NE US" | eval annotation_label=MaxTemp | eval annotation_category=State </query>
</search>
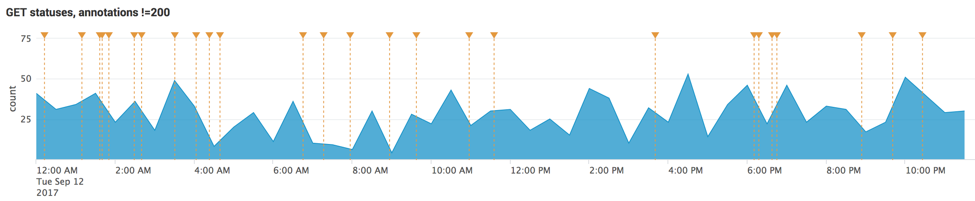
Status codes are an integral component of web access logs. As demonstrated in the graph below, we can use Event Annotations to highlight different errors across a set of access logs. This can be useful to in finding when certain errors may crop up more often, or in association with significant events. Your search can be refined to specific status codes as well instead of just error codes. Annotated events can become an integral part of a site’s health monitoring system.
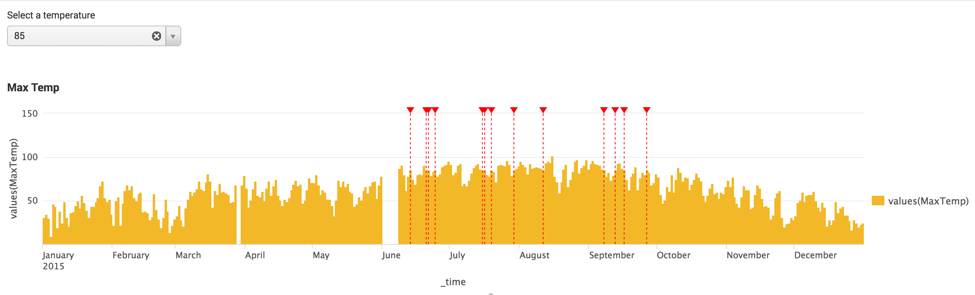
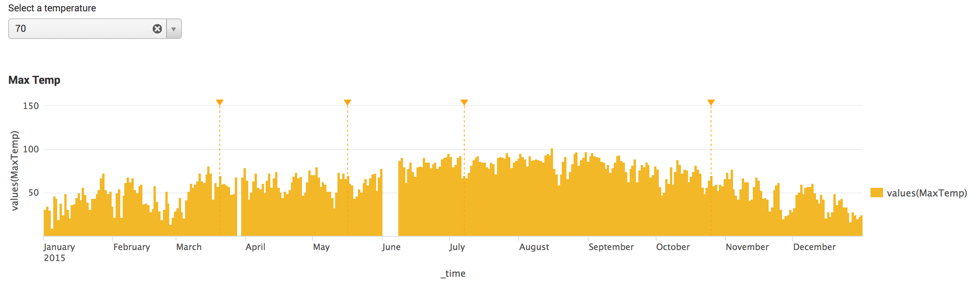
When needing to showcase specific values, annotated events are the perfect tool. In the graph below, it's specifying a temperature (in this case 85 degrees) over a time chart of maximum temperatures. Beyond weather, this can be used in many interesting ways. It could be used to separate specific users to monitor login activity or it could be used to identify certain status codes. A dropdown can be implemented in order to change which specific value you want to be highlighted. Annotated events have the capability to highlight a myriad of different events. They can also highlight different events through coloring of the events.
Event Annotations provide a perfect at-a-glance view into your data. It allows you to display information even easier than Splunk did before, enabling a new, presentational style to draw users attention exactly how you want to.
What creative Splunk use cases can you solve with Event Annotations? Comment below!
Have questions about Event Annotations? Email us at support@function1.com.
- Log in to post comments
