New in Splunk 7.0 – Metrics!
Like most avid Splunk users and admins, our team at Function1 was excited to hear about the release of Splunk 7.0 and all of its powerful new features and enhancements. One of the bigger announcements was Splunk 7.0's debut of a new data type called Metrics.
Splunk’s goal in introducing Metrics is to provide organizations with a highly efficient and scalable method of ingesting, utilizing, and extracting business value out of metrics from critical IT systems.
What are Metrics … and why are they important?
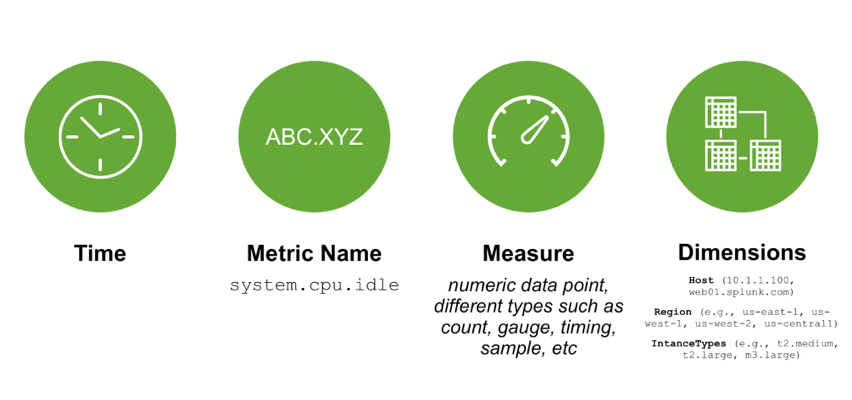
In short, Metrics are numerical values that pertain to an activity or process measured of an interval of time. Almost every aspect of an IT infrastructure emits various types of Metrics. These, of course, include: applications, servers, network devices, and sensors. In terms of a high-level categorization, Metrics can often be segmented into either Work or Resource Metrics.
Work Metrics are used to assess the top-level health of your systems by measuring useful outputs. This category would include metrics like: throughput, success and error counts/percentages, and performance stats (such as latency). This data can be extremely valuable in answering the most important questions about a systems health and performance.
Resource Metrics generally capture data surrounding specific components of an IT infrastructure that serve as resources to other systems. This category would include metrics like: utilization, saturation/queue percentage, internal errors and resource availability. These metrics can be crucial in constructing a more detailed view of a system’s state, and can be vital for diagnosing problems and performing in-depth investigations and troubleshooting.
Metrics in Splunk!
Let's check out some of the highlights of Metrics in Splunk:
- Metrics are stored in a new optimized index. See "Get Started" with Metrics here: https://docs.splunk.com/Documentation/Splunk/7.0.0/Metrics/GetStarted.
- Metrics can be gathered using different tools and sources such as, collectd and StatsD, both of which are predefined sourcetypes out-of-the-box in Splunk 7.0. Other metrics-gathering tools can be used with custom configurations of props and transforms.
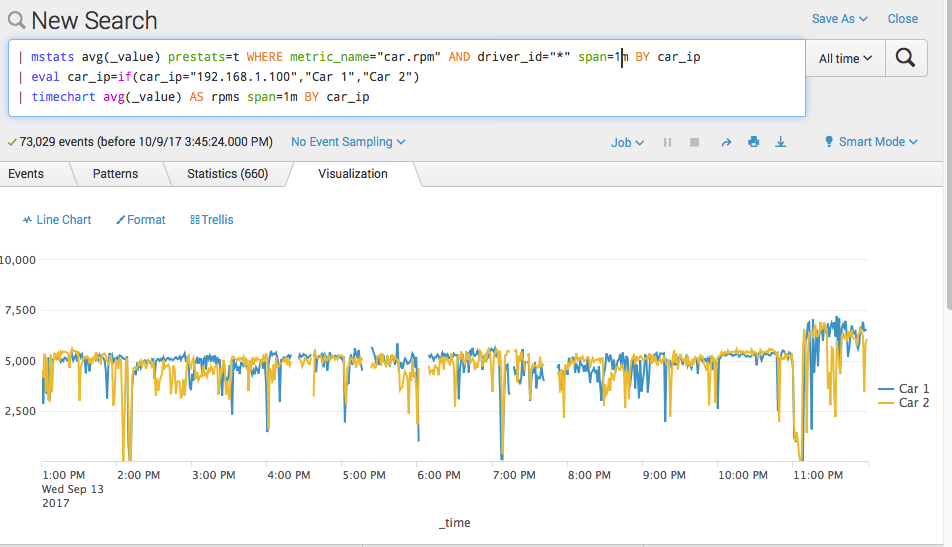
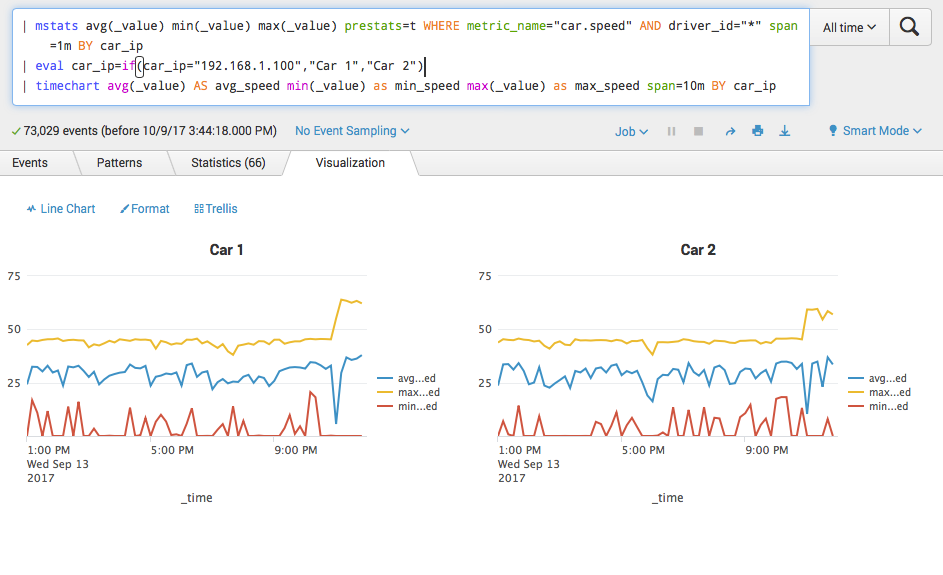
- A new SPL command (mstats) has been introduced to allow for efficient queries against Metrics data. This command functions much like other statistical SPL commands (tstats, stats, etc...).
- Search speeds of up to 200x faster when querying Metrics than standard log/event data!
- Splunk allows correlation of Metrics and log data to provide greater visibility and context when troubleshooting issues. One great way to do this is via the new feature of Event Annotations: https://docs.splunk.com/Documentation/Splunk/7.0.0/Viz/ChartEventAnnotations.
Components of the New Metrics Index
As part of the Splunk 7.0 Overview app, they included some test data (racing Metrics). To demonstrate the use of the mstats command, I ran a couple of searches to provide comparisons of two cars.
We're looking forward to helping our customers start to gain value from Metrics! As always, please reach out to us at info@function1.com if you need assistance with your Splunk deployment.
Credits:
Title Image: http://www.tech-coffee.net/wp-content/uploads/2016/04/cloud.jpg
Whats New in Splunk Enterprise 7.0: https://www.splunk.com/blog/2017/09/26/what-s-new-in-splunk-enterprise-7-0.html
Splunk Enterprise 7.0 Overview App: https://splunkbase.splunk.com/app/3691/
- Log in to post comments
