We are All In This Together: Engaging Data Owners
Splunk administration is as much about people as it is about software technology. Communicating about needs and setting expectations helps to increase the value of Splunk and ease its use.
Use Case
The use case I'd like to cover here is when a data owner is working with a Splunk adminitrator to on-board a new data source into Splunk. It can be helpful to add some automation and structure to the process so that the data owner can review their data as soon as its available in the system. This approach is especially helpful if the on-boarding process requires action from other members outside of the Splunk administrator and data owner that may take some time to occur. The strategy discussed here will be to use an alert to notify the data owner that the data is available in Splunk and a simple dashboard to help the data owner review their data.
The Dashboard
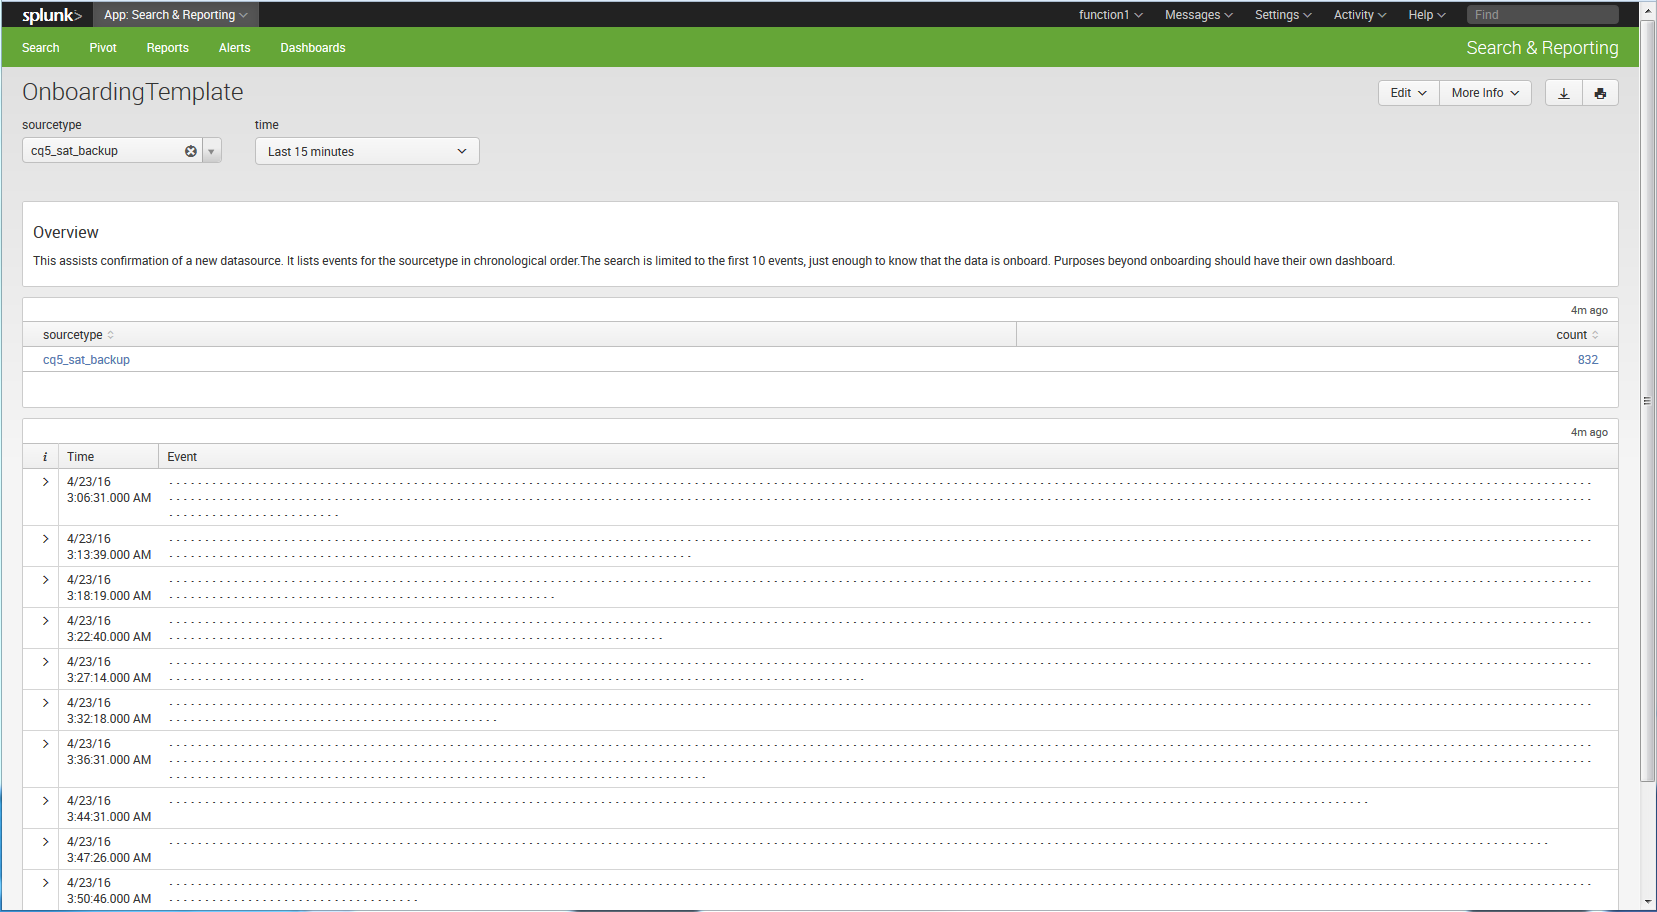
The first thing to do will be to create a dashboard that the data owner will use to view their data. In our example, the dashboard contains a dropdown for "sourcetype" so that the data owner can quickly view different types of data. Once a sourcetype is selected a search using the "table" command is used to display the extracted fields in the data's events.
Simple XML for Dashboad Example

<form>
 <label>OnboardingTemplate</label>
 <fieldset submitButton="false">
   <input type="dropdown" token="source_tok" searchWhenChanged="true">
     <label>sourcetype</label>
     <choice value="*">All</choice>
     <choice value="EXAMPLE_access_log">EXAMPLE_access_log</choice>
     <choice value="EXAMPLE_dispatch_error_log">EXAMPLE_dispatch_error_log</choice>
     <choice value="EXAMPLE_dispatcher_log">EXAMPLE_dispatcher_log</choice>
     <choice value="EXAMPLE_error_log">EXAMPLE_error_log</choice>
 </fieldset>
 <row>
   <panel>
     <event>
       <search>
         <query>index=EXAMPLE sourcetype=$source_tok$ | table * </query>
         <earliest>$field1.earliest$</earliest>
         <latest>$field1.latest$</latest>
       </search>
     </event>
   </panel>
 </row>
</form>
The Alert
Now that the dashboard has been created, a saved search is created to look for the data in Splunk. This search can be as simple as "index=my_index sourcetype=my_sourcetype." The search is configured to alert and send an e-mail to the data owner. Unless it's extremely urgent that the data be validated right away, the search can be configured to run every hour and throttled accordingly so that once data does appear, the data owner is not flooded with alert e-mails.
Alert Example
[OnBoarding Rev - New Sourcetype]

alert.digest_mode = True

alert.suppress = 0

aler.track = 0

cron_schedule = 0 * * * *

description = Discovers data on-boarded into Splunk

dispatch.earliest_time = -1h@h

dispatch.latest_time = @h

enableSched = 1
Search used for the alert
index=EXAMPLE sourcetype=example_proxy | head limit=1 | outputlookup example_new_source_sourcetype_lkupPulling It All Together
Onboarding data is a process. Much of the communication between Splunk administrators and data owners is predictable, so a process can be created to help automate this. Using alerts and dashboards adds consistency. It makes effective use of Splunk’s core features from the start of the process and is a win for all.
- Log in to post comments
