Event Sampling - Splunk 6.4 Feature
By: Rupak August 02, 2016


There have been countless instances when I was on a client site and tasked with building custom dashboards on large data sets, with a requirement to search over the past 3 months or greater. Each minor tweak or adjustment to the search would require me to run the entire search again, which on development systems would be a huge time sink. My life would have been so much easier, and I would have saved loads of time, if there was a way to run my searches against a smaller data set. Obviously, I could achieve this by, for example, running my searches against a shorter time frame but I would then face the possibility of not seeing certain types of events that could affect the outcome/validity of the dashboard.
Thankfully, one of the new features released with Splunk v6.4 is Event Sampling. With this new feature, you can have Splunk only return a given portion of results so your search can complete faster. You provide a sampling ratio and Splunk uses a "statistically valid" (says Kevin Faulkner, a Sr. Director, Product Marketing at Splunk in this blog) method to determine which events should be returned. Let’s chalk it up to it being part of Splunk's secret sauce and we may not fully understand how the returned events are chosen, but we can be certain it’s not just completely random, most recent/oldest events, or events that all share a specific characteristic. The result set that is returned should be a solid representation of the entire data set so you can build reports/dashboards from that data with confidence.
You can use it directly on the Search UI by choosing the sampling ratio you want to use. You can pick from a dropdown of given values, or create a custom ratio.
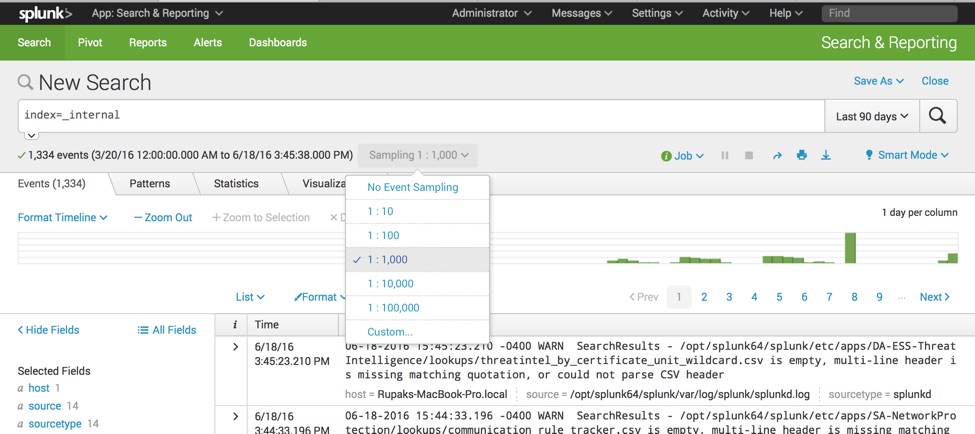
Keep in mind that the sampling ratio you choose will stick, if you run/update your search in the same window.
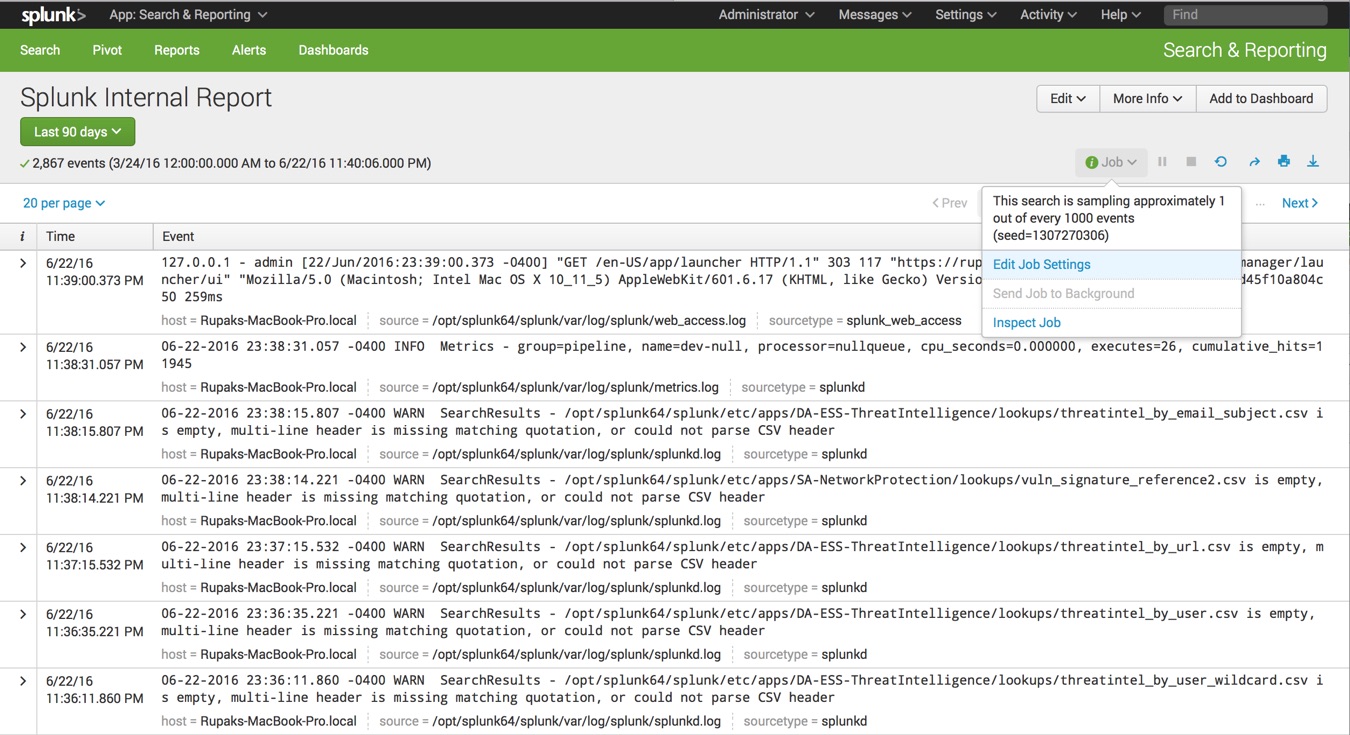
The sampling ratio can also be saved with reports. If you build a search in the Search UI utilizing a sample ratio and proceed to save it as a report, it will be saved with the sample ratio you used to build it. When the report is later run, you can see the sample ratio that was used under the 'Job' drop down on the right side of the screen.
You can also add a sampling ratio to your dashboards by utilizing the 'sampleRatio' tag in simple XML. This is how I would have used it when creating those custom dashboards that looked back at data from 3 months ago.
<search>
<query>index=_internal sourcetype=scheduler </query>
    <earliest>-90d@d</earliest>
    <latest>now</latest>
    <sampleRatio>1000</sampleRatio>
</search>
The value that you set for the sampleRatio is the denominator for the sample ratio. So in this case, the sample ratio would be 1/1000. If you choose to add a sample ratio to your dashboard for testing purposes, be sure to remove it after development. This is an important point to remember as the sample results can have undesired results if you are performing statistical calculations on your data: sum, count, max, min, distinct count, etc. For more information on this, check out the Splunk docs.
I highly recommend reviewing the Splunk 6.4 Overview app for more information and examples of this great feature as well as the various others.
Happy Splunking!
Feature picture courtesy of -- http://www.zazzle.com/cool_sample_size_bro_canvas_print-192390779559114753
- Log in to post comments
