Every Click You Make, Splunk is Watching You…

When I am at client sites I often get asked how they can get a better understanding of what is going on in their Splunk environment. A recent client wanted to understand what dashboards were being used the most in their environment and who were the top users. What a great thought! I knew that Splunk had to have a way to track this. It was just a matter of locating the data and then determining the best way to pull it. After going back and forth between metadata and the internal index, I came across this in Splunk’s internal index.
index=_internal sourcetype=splunk_web_access.
This was a great start as it showed the user and the url, but we wanted to make sure that we had fields for the app and the actual views that users were using. Also, we wanted to make sure we had the right method and status.
So the final base search looks something like this:
index=_internal sourcetype=splunk_web_access method=GET status=200 | rex "GET\s/[^/]+/app/(?<app>[^/]+)/(?<view>[^\s?]+)
This gives us the base for how we would start to create our dashboards. After adding the regex to our props.conf, we then have the app and view fields. Now we are ready to start creating some panels.
While there are many ways to manipulate this search, I will give some examples to help you start to create the perfect dashboard for you!
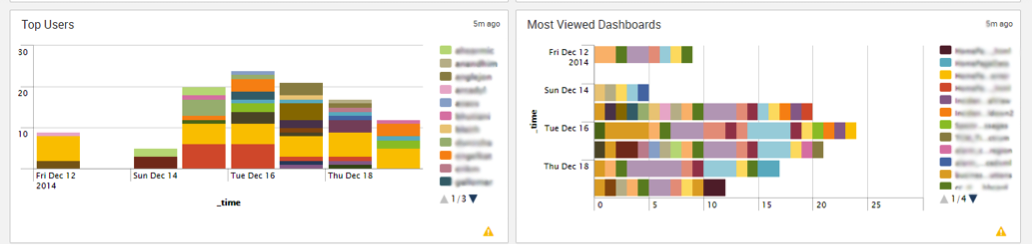
index=_internal sourcetype=splunk_web_access method=GET status=200 | timechart limit=0 dc(view) by user
and
index=_internal sourcetype=splunk_web_access method=GET status=200 | timechart limit=0 dc(view) by view
These searches will give you visualizations that look somewhat like these: (the names have been hidden to protect the innocent…or guilty)
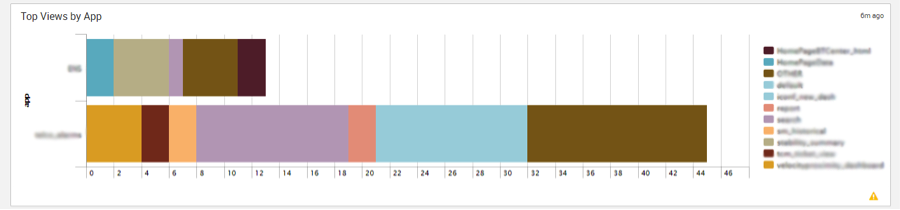
Another search that I found helpful was to see the views per app in the environment.
With a simple search:
index=_internal sourcetype=splunk_web_access method=GET status=200 | chart dc(user) by app view
This can be a great tool to help customize and understand your Splunk Environment. Let me know some of the searches you come up with!
And remember…Splunk is always watching you!! :)
