Taking a closer look
By: Ridwan May 03, 2013


Ever have a well-formed search on Splunk that is running too slowly? Of course, they can always go faster, but there are times when it really just seems like something is holding back your search speed. That leaves you wondering where in the chain of information transfer is the problem, really? And just when you're about to throw your arms up in despair: don't worry, job inspector is here!
The job inspector is one of those tools that Splunk provides which are often overlooked because of the plethora of other better-known tools. A quick glance at so many details in one place, though, can be invaluable. Let's take a look at a Job Inspector page and see what we find!
Where is this thing?
Firstly, how to get there in the first place-- the Job Inspector (let's call it JI, for now) can be accessed in several ways.
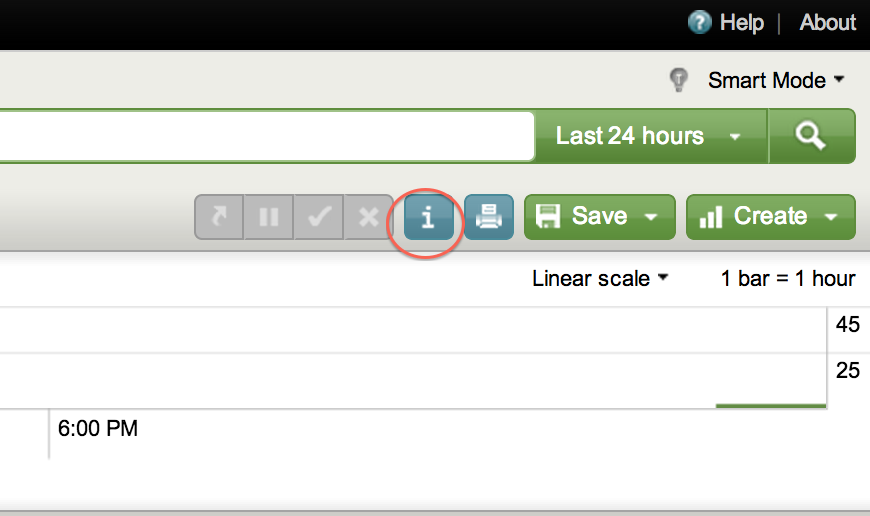
1. The one you have surely wondered about: the "i" button in-between the "cancel search" and "printer" buttons.
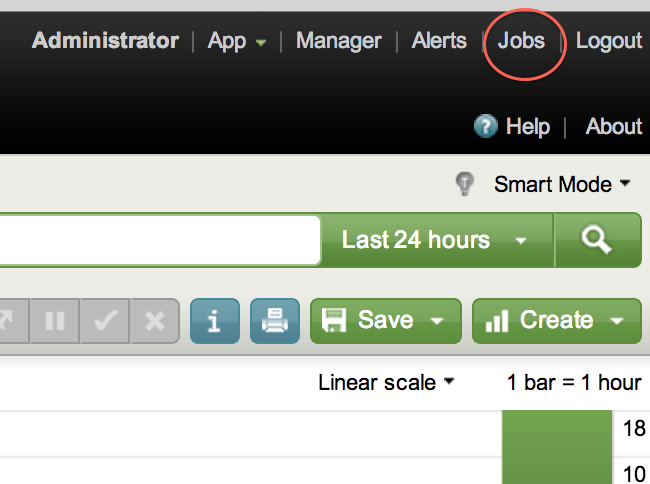
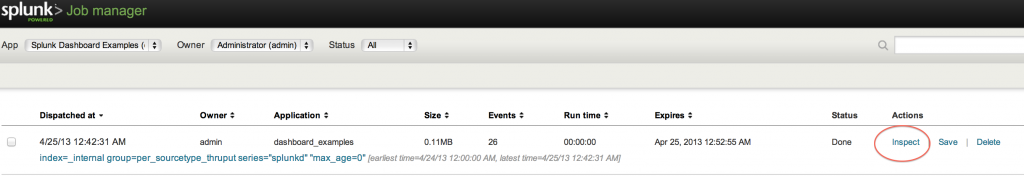
2. The second way to get to the JI is by clicking the "Jobs" button on the top of any Search screen, to get to the Jobs Manager screen, where you can see a list of all the jobs currently not expired (or ongoing). Next to each search job, there is a link called "Inspect" which opens the Job Inspector for that particular search.
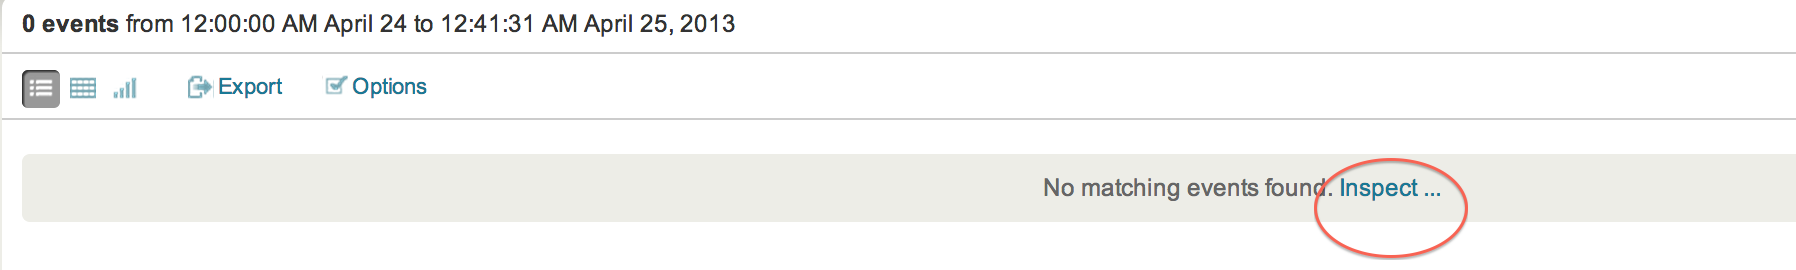
3. The last way of getting to the Job Inspector I will mention comes to you at your most desperate time-- when there are no search results! Right after the line saying "No events found," there is the link to click on the word "Inspect" which takes you to the job inspector.

What's on this page?
Now we know several ways to get to the page, let's look at what it contains. Let's start at the top of the page.
Search ID
One of the most important bits of information that can be found through the JI is the Search ID number. This can be seen at the end of the URL in address bar once the job inspector is opened.
One of the most important bits of information that can be found through the JI is the Search ID number. This can be seen at the end of the URL in address bar once the job inspector is opened.
For example, it may say in the address bar: "http://ridwans-computer:8000/en-US/search/inspector?sid=1366863406.7&nam...". Here in this example, the Search ID ("sid") is '1366863406.7'. This is important for various functions in Splunk, primarily to recall search results.
Messages
The first few lines on the page mention how many search results were returned, how many events were scanned, and how fast the search was completed. Immediately thereafter, there are several lines of messages. If you got to the JI because there were no results in your search, the part of the search that is not causing that result will be highlighted. This can give a great insight into non-functioning searches. The Search ID is also repeated in this initial part of the page.
Looking further down the JI page, you will notice there are two major divisions: Execution Costs and Search Job Properties.
Execution Costs
Execution costs lists information about the components of the search. As the name implies, this is really where you find out how much of an impact each part of your search has on the overall performance of the search. And hence which parts of the process are under-performing. I will not replicate here the detailed description of each of the parameters on which JI reports, as they are available here in the Splunk Documentation. Breaking down the cost values should help narrow down the causes for slow searches. For example, it can reveal the time spent in fetching results from search peers (dispatch.fetch) , or if it is a particular part of your search (dispatch.evaluate.<command_in_search>) that is increasing the time it takes to return results.
Search Job Properties
Search Job Properties lists other details related to the search such as the server information and environment. These fields are also discussed in detail here in the Splunk Documentation, where you can see what each of them stand for. Some of the fields, like "DiskUsage" are quite simple to grasp; others, such as "eai:acl" are more meaningful with the help of the Splunk documentation. But this gives very important information at a glance about permissions and user access, which could explain why a search is behaving a certain way.
I hope this short look at the Job Inspector in Splunk will give you some insight into a handy new tool for your Splunking adventures. If you need any help, let us know!
- Log in to post comments
