Troubleshooting the Splunk App for Enterprise Security
Intro
Welcome Splunkers! In this post, I'd like to talk about an issue I encountered recently when working on a Splunk App for Enterprise Security v2.2.1 (ES app) deployment and the approach I took in troubleshooting it. But before getting started, I'd like to congratulate Splunk and their Security Products team for winning the SC Magazine Award for "Best Security Information/Event Management (SIEM) Solution." Cheers to a job well done!
Initial Installation
As per best practices, the ES app was installed on a dedicated search head, which was specifically stood up for this deployment. I started the data source configuration process and installed a few technology add-ons (TA's). Things were looking pretty good, as I was seeing data in the Network "...Search" pages, such as "Traffic Search," with the expected fields being properly extracted. I did notice however that the "...Center" dashboards, such as "Traffic Center," were not showing data. For the time being, I chalked this up as being due to the fact that this was a new installation and it was going to take a little while for scheduled searches to kick in.
Data Verification
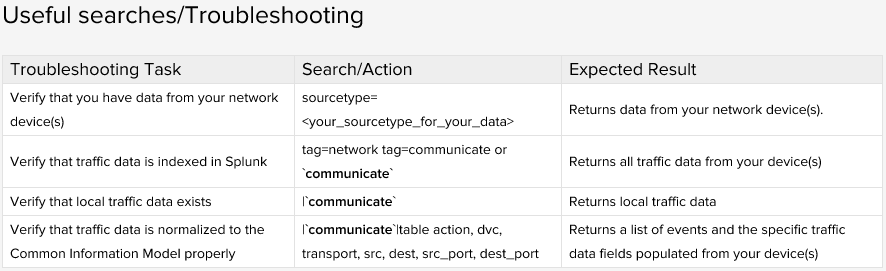
Some time had elapsed and the "Traffic Center" dashboard was still not showing data. So I began the normal process for troubleshooting dashboards in the ES app. I navigated over to the ES app area on Splunk docs, specifically the area related to mapping data to the Traffic Center dashboard. As you can see in the table below, Splunk provides some really useful searches to run to determine if the data is configured properly.
Even though the data looked correct in the Traffic Search page, which shows the raw events, I wanted to start here, just to make sure I wasn't missing anything. The searches are ordered in a progression, with the most basic in the beginning and then getting somewhat more complex. In general, the search queries either reference a macro, such as "`communicate`" or list which tags to search for. These are the same macros and tags that the scheduled searches use when populating summary data, either in summary indexes or TSIDX namespaces. I ran the searches and the data was returned as expected. In "normal" situations, these searches usually indicate that the data source might not be configured correctly and therefore the supporting searches can't "hook" into the data. However, this was not the case here.
Note: It's important to run these searches in the "Search" page within the ES app, because the ES app takes advantage of a recently added feature in Splunk called "app isolation." This means that an app can choose to isolate itself from other app's configuration. The advantage of this is that multiple apps can run side-by-side and are guaranteed to not have configuration conflicts or leaks. By searching within the ES app's Search page, it's guaranteed that the same search-time configuration that the ES app is using is being applied to the ad-hoc, troubleshooting searches being run.
Delving Deeper into the Dashboard
At this point, the Traffic Search page and the troubleshooting ad-hoc searches were both returning data. It was time to dig deeper and find out exactly why the Traffic Center dashboard was not populating. I wanted to see what searches were driving the dashboard, so I navigated to the "Network Protection" Domain Add-on (DA) which was located at $SPLUNK_HOME/etc/apps/DA-ESS-NetworkProtection/default/data/ui/views I examined one of the searches from the page and it was pulling information from a TSIDX namespace called "sa_traffic." TSIDX files are stored locally, so on the search head I navigated to "$SPLUNK_DB/tsidxstats/" and looked for an "sa_traffic" directory, but could not find one... Okay, so we're getting closer, why is the "sa_traffic" TSIDX namespace empty? Let's try to find out which search populates this namespace. In the ES app documentation, you can find out which searches populate which TSIDX namespaces. Below is the information for sa_traffic:

As you can see there is two searches which populate this namespace, "Network - All Communication Base" and "Network - All Communication - TSIDX Gen," which is a post-process of the "Base" search.
Scheduling Saved Searches
After identifying the populating searches for the "sa_traffic" namespace, I navigated to the Manager through the web UI to see if these searches were enabled and scheduled to run. In the web UI, I noticed something interesting, the searches were enabled but the scheduled time was set to "none." I clicked on a search and it had the correct scheduling configuration. I also ran one of the searches in the search bar which did populate the "sa_traffic" namespace, thus further confirming that this was not a data source configuration issue. Okay, so here we have a pretty clear indication something is wrong. My first thought was if there was a problem with the job scheduler on the search head. I ruled that out by not finding any errors in the scheduler.log file (the events from here are stored in the _internal index) and seeing that saved searches for another app were executing at the correct scheduled times and were producing results. The app I was using as a comparison was the Unix app. In Manager, I noticed that its owner was set to "no owner" whereas the owner of the ES app's searches was set to "admin." In order to rule this out as an issue, I wanted to set the owner to "no owner" for the ES app's searches. In the "$SPLUNK_HOME/etc/apps/SA-NetworkProtection/metadata/default.meta" setting, I noticed the following stanza: [savedsearches]owner = admin In order to change the owner to "no owner" you can (1) delete this line from the default.meta file, (2) change this to "owner = nobody" or (3) create this stanza in a local.meta file and set owner to "nobody" Option 3 would be the recommended way to go because it leaves the default configuration file undisturbed. This is important so that a dependency is not created on any default configuration files, which may be over-written during an upgrade of the app. So, with my fingers crossed, I set "owner = nobody" in a local.meta file in the same directory and restarted Splunk on the search head. Upon restart, the first thing I did was check to see if the scheduled times showed up correctly in the Manager, which they did! After popping open a bottle of champagne (well actually a Mountain Dew...) I kicked back for a few min. to see if the scheduled searches would run, there was one due in a few min. Feeling pretty confident they would work, I went straight to the Traffic Center dashboard to see if any of the charts displayed data, and lo and behold they did. Although only two bars were displayed at the moment, one from the manual run of the saved search, and one from the most recent execution, I was fairly certain, things were looking good. I checked on the dashboards and the charts were displaying data.
Resolving the Owner Issue
One might think, that we could stop here, that the problem has been resolved. However, as you'll recall, there's still the issue of why setting "admin" as the owner was causing an issue. After meeting with the customer, I learned that when a new search head is stood up in their environment, the local admin account is deleted per a security requirement. I was using a domain account which was assigned the "admin" role, so had no need to use the local admin account up until that point... The reason the ES app sets the owner to "admin" is that it guarantees the user the saved searches run under has a max concurrent search limit of 50 (unless of course the properties of the default "admin" role is modified...). This is necessary as the ES app can run a number of saved searches in the background. If the owner is set to "no one" then this is not guaranteed. Therefore, the best solution in this case, is to create a separate account to use as the owner of the saved searches. This account would then receive the "admin" role or another role which was configured to run at least 50 concurrent searches. This configuration was implemented and the ES app was happily chugging along its way.
Summary (or TL;DR)
The ES app by default sets the owner of the saved searches to the local "admin" account to ensure there's no constraint met when running a large number of concurrent searches. If necessary, another account can be used to function as a "search service" account. Hopefully this post helped in understanding some of the inner workings of the ES app and how to troubleshoot it. Happy Splunking, cheers!
- Log in to post comments
