Splunking Drupal

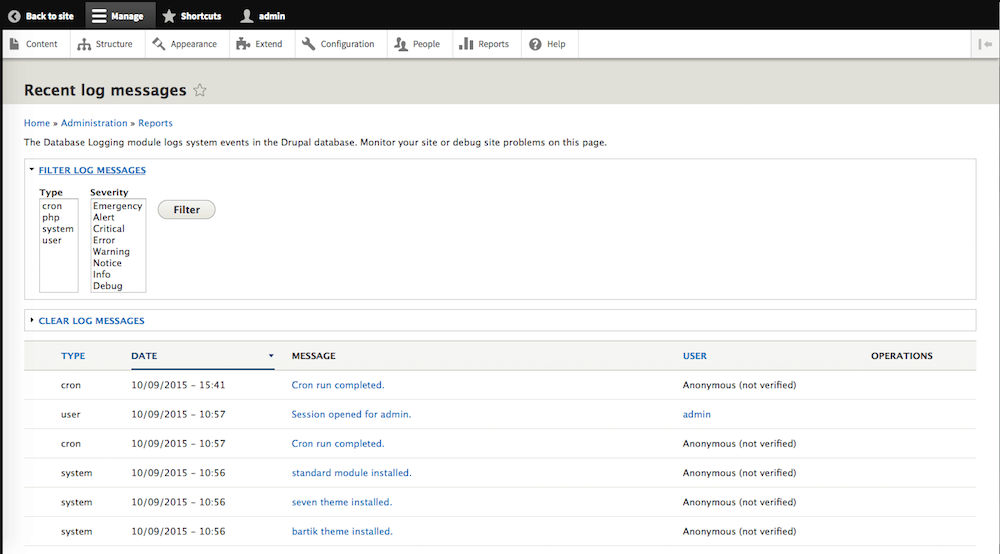
Drupal developers rely on various logging systems to troubleshoot and investigate Drupal exceptions and errors. We can use frontend Apache/Nginx access and error logs along with native PHP logs. But, unquestionably, the Drupal database logging module is at the core of these logging frameworks because it captures all triggers to internal Drupal hooks, events, and activities occurring on the Drupal site. Drupal's database logging framework is the bucket that captures not only the operations of the different modules (core and contributed) but also includes usage and performance data; therefore, it is an indispensible debugging tool and perhaps the Drupal core report at <drupal-site>/admin/reports/dblog is the most visited page for developers and site admins to ensure that the Drupal site is operating properly. As the Drupal site is prepped to go live, for performance reasons it is a common best practice to turn off database logging and route its traffic to Syslog instead. The Syslog logging format is identical to database logging, just a different output framework. But regardless of the output framework, database or Syslog, relying on either for troubleshooting purposes is a painstaking approach. The database report is a primitive interface that hasn't evolved much over the Drupal releases. While we can filter on message type and severity, we can't plot these over a timeline, or search on message text, or filter on source IP, or identify the URI that triggered a given message. We can export the data to an Excel spreadsheet where it can be sliced and diced, but that is just unproductive and offline. Moreover, while in Syslog format, we rely on even further primitive techniques to “grep” and “tail” the file hoping that we identify a pattern.
Over the past few years, I've attended a number of different Drupal conferences and I do not recall in any of these events that I've heard the term “Splunk” (whether in a keynote event or a session) though the technology is a renowned and can remedy many of the flaws mentioned above, specifically if the Drupal site is complex in nature with a large volume of hits and visits. You can Google "Splunk Software" but its simplest definition is: a software platform designed to parse, index, search, analyze, and visualize machine data gathered from a website, application, sensors, devices, appliances, etc. In our case, we will be focusing on Drupal generated logging data.
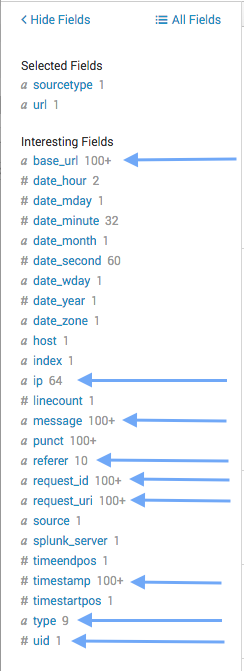
- base_url -> base URL of the site.
- timestamp -> Unix timestamp of the log entry.
- type -> category t which this message belongs.
- ip -> IP address of the user triggering the message the message.
- request_uri -> the requested URI
- referrer -> HTTP referrer.
- uid -> user id triggering the message.
- link -> Link associated with the message.
- message -> message text stored in the log.
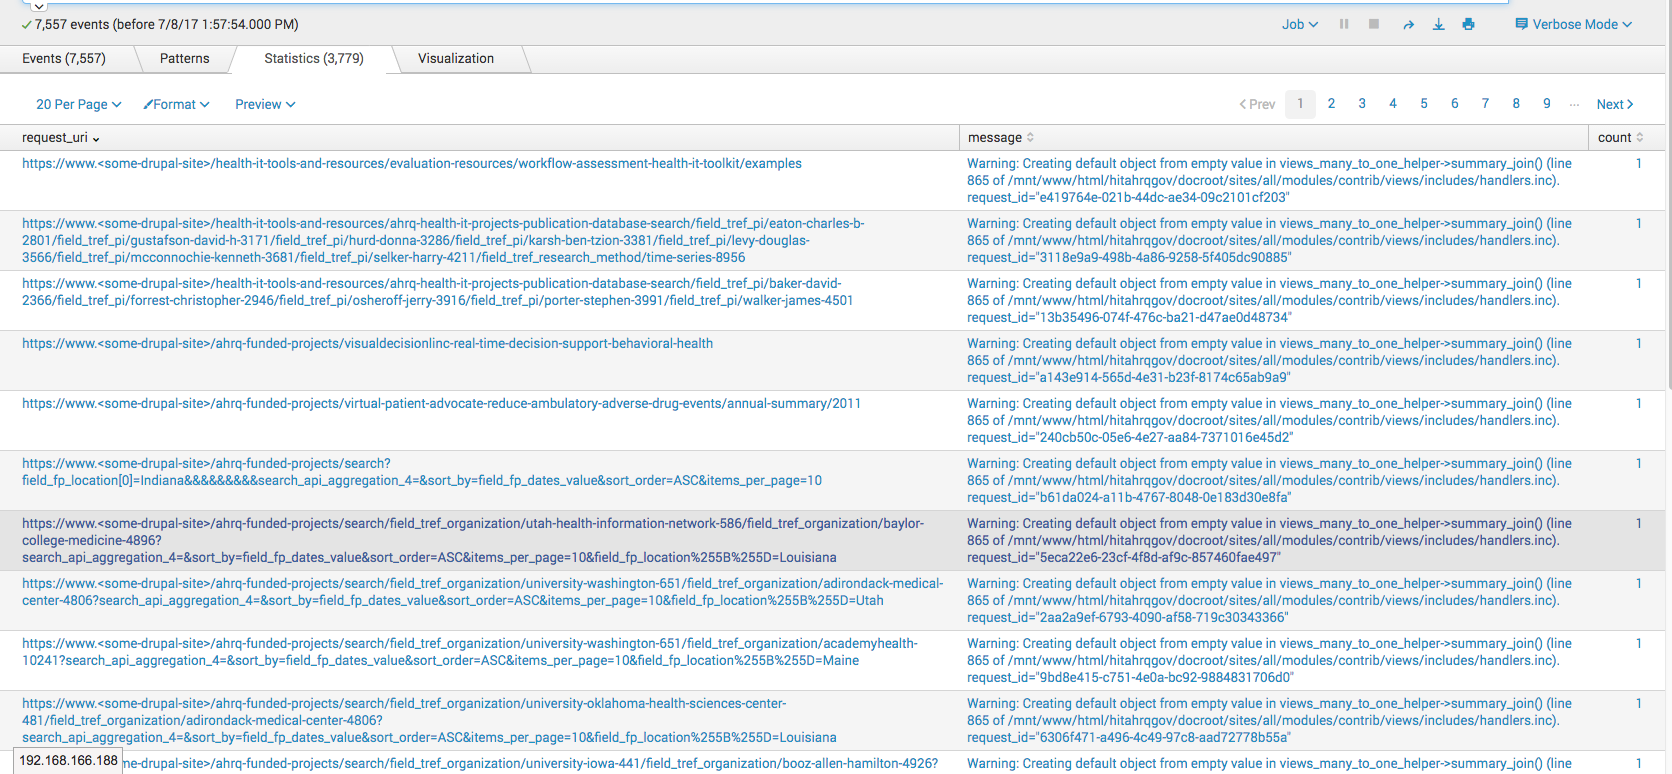
Once in Splunk, we can slice and dice the data using its search processing language. The use cases are myriad, but below are a couple of typical use cases:
Identify request_uris generating most errors of type "warning"
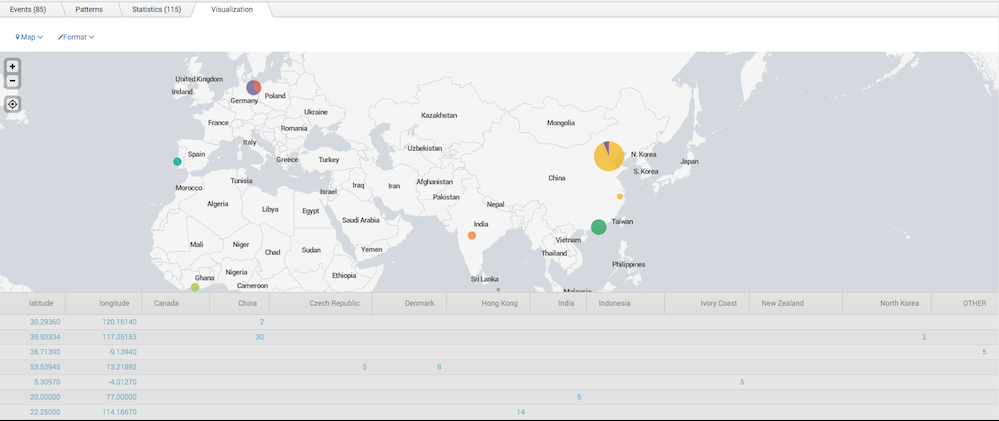
Identify IPs with most invalid login attempts and identify source countries.
- Sales by geographical region/country.
- Sales by product category.
- Sales by product.
- Monthly/quarterly/yearly sales comparison.
- Sales by payment types.
- Log in to post comments
