Splunk ES - Lets Correlate
Splunk ES – Creating Custom Correlation Searches
In today's blog I will be discussing one of the very valuable features of the Splunk App for Enterprise Security. Correlation searches provide a very highly customizable level of security based detection and alerting within Splunk and ES.
What is a Correlation Search?
A correlations search is a type of saved search used to detect suspicious events or patterns in your data. If a suspicious event is detected, a notable event is created. The notable event can then be investigated using the Incident Review dashboard in ES.
Why Create a Custom Correlation Search in ES?
Custom correlation searches allow you to generate notable events and monitor specific patterns in order to provide you an alert when those patterns are found. They search for cross data-type correlations that give you an understanding of evolving threat scenarios in real time. Ultimately, creating a custom correlation search will allow you to seek out specific security threats specific to your environment.
To Create a Custom Correlation Search:
1. Navigate to Configure > General > Custom Searches
2. Select New
3. Select Correlation Search
Search Name Create correlation search title/descriptor
Application Context Select app that will contain the correlation search
Description Provide a brief description of the correlation search
Search Provide the correlation search sting
Time Range
Start time Set earliest time for search
End time Set latest time for search
Start time and End time should be expressed in relative time. Refer to the link in the footnote for relative time examples[1].
Cron Schedule* Set cron schedule
Throttling
Window Duration Set a relative time range defined in seconds at which, during this time range, any additional event that matches any of the Fields to group by will not create a new alert.
Fields to group by Enter a search field used to match similar events, at which, during the Window duration, any additional matches for the correlation search will be compared to the field defined in Fields to group by.
Notable Event
Create notable event (check box)
Title Create the notable event title. This title will appear on the Incident Review dashboard.
Description Provide a description of the notable event.
Security Domain Set the security domain field of the notable event
Severity Set the severity of the notable event
Default Owner Set the default owner of the notable event
Default Status Set the default owner of the notable event
Drill-down name Create the name for Contributing Events (link in a notable event)
Drill-down search Provide the search for Contributing Events (Drill-down)
Risk Scoring
Create risk modifier (check box)
Score Set the default score assignment for the notable event
Risk object field Set the search field the risk Score is applied to
Risk object type Set the type of object the risk Score is applied to
Actions
Include in RSS fees (check box)
Send email (check box)
Email subject Provide email subject line. Defaults to “Splunk Alert: $name$”, where $name$ is the correlation search Search Name
Email address(es) Provide email address(es) that should receive the alert
Include results in email (check box)
As CSV (from dropdown)
As PDF (from dropdown)
Incline (from dropdown)
Run a script (check box)
File name of the shell script to run
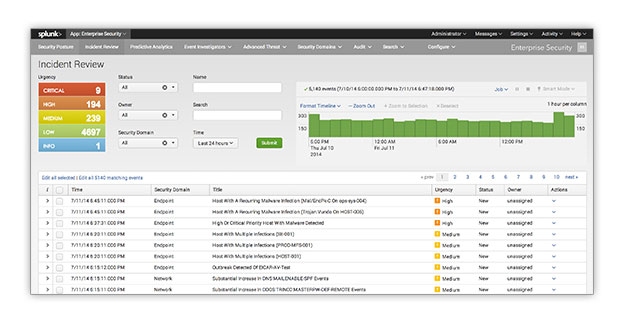
Incident Review and Notable Events
Once you have finished testing your correlation searches and have saved it in production they will start populating notable events in the Incident Review dashboard. Analysts will then be able to use the dashboard to gain insight into the severity of events occurring within your system or network. They will use the dashboard views to triage new notable events, examine event details, and assign events to analysts for review and resolution.
More information on the incident review dashboard can be found here: http://docs.splunk.com/Documentation/ES/latest/User/IncidentReviewdashboard
As always, thanks for reading and please feel free to contact us with any of your Splunk questions.
- Log in to post comments
