Python 2’s End-of-Life is rapidly approaching, here’s what that means for your Splunk Deployment

In case you missed it, the version of Python that Splunk currently bundles and ships in Enterprise (Python 2.7) will be end-of-life January 1, 2020. How will this impact your Splunk deployment? Here's our detailed guide!

The What

Since a lot of Splunk customization can be achieved through Python, Splunk Enterprise now supports Python 3 and any Apps or Add-ons with Python 2.7 code will need to be updated to Python 3 compatibility. 

...


Splunk .conf19 Preview: Add these 5 must-see sessions to your schedule

In just a few days, we’ll be heading (back) to Vegas for Splunk .conf19 - the 10th anniversary of Splunk’s biggest event of the year - and this time we’re bringing our expertise to the Developer track (more on that later). As a proud Splunk PS partner and .conf veterans, it’s been exciting to watch the event evolve...


Building more secure financial institutions with three simple letters

While organizations (and their customers) are openly embracing digital transformation for unprecedented progress in experiences and efficiencies, cybercrime continues to play an increasingly menacing role. In 2017 alone, cybercrime cost organizations across sectors $11.7 million annually (on average), a 22.7% jump from 2016. 

Among industries, financial services companies were hit hardest with damages rising to $18.28 million. This doesn’t exactly come as a...


Get More Out of Splunk in 2018 with These Powerful Products

You might have noticed that our Operational Intelligence team was busy in 2017. Between three different product launches. . . you're probably wondering: when do they sleep? I'm still not sure the answer to that, but we're pretty proud of all the sweat, blood, and tears that have gone into elevating our services and extending the power of Splunk for our customers; and so I thought it might be helpful to pull together a quick round-up of the latest and greatest Operational Intelligence products by Function1. 

Bloodhound App for...


Tips & Tricks: Splunk's Monitoring Console

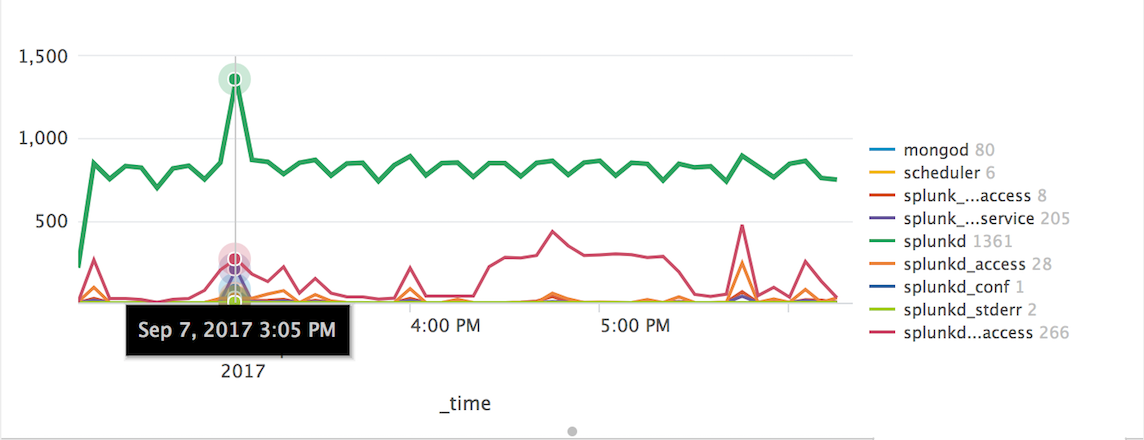
Since Splunk enterprise released 6.5.x "The Distributed Management Console" app was renamed to "The Monitoring Console"; the app name change was not just a rename as the tool got bundled with a number of enhancements. The gist behind the monitoring console is its myriad of dashboards that provides a birds-eye-view health check of a multi-instance Splunk deployment. The dashboards behind the console rely on data collected from the different Splunk Enterprise deployments' internal logs located in both $SPLUNK_HOME/var/log/splunk/ as well as $SPLUNK_HOME/var/log/introspection/. But this blog...


5 Tips to Keep Your Customers Safe this Holiday Season

After a record-breaking Cyber Monday (with online sales soaring to $6.59 billion - a 16.8% increase over last year), Adobe is predicting that this will be the first-ever holiday season to surpass $100 billion in online sales. This is clearly fantastic news if you're in e-...


Using Splunk to Analyze New York City Uber Data

It’s fun getting all types of data into Splunk, analyzing it, and learning something new. I was pretty excited when I found this Uber trip data from FiveThirtyEight with 4.5 million records of Uber pickups from April - September 2014. Uber also debuted Uber Movement which is offering access to their data if you get on a waiting list. If you are interested in Uber data, you should definitely check that out. 

...


Overview of the New Charting Enhancements in Splunk 7.0

Charts are highly configurable in Splunk and in Splunk 7.0 they have added more charting options to use in your dashboards. These charting enhancements improve metrics and multi-series monitoring use cases while elevating user experience.

In this blog post, I will provide an overview of the new charting options available with Splunk 7.0 and give you examples you can use for reference. 

charting.lineWidth

The first charting option allows you to change the line width of your charts in pixels.   

In the the XML example below, I've taken it...


Splunking The Billboard Hot 100 with help from the Spotify API

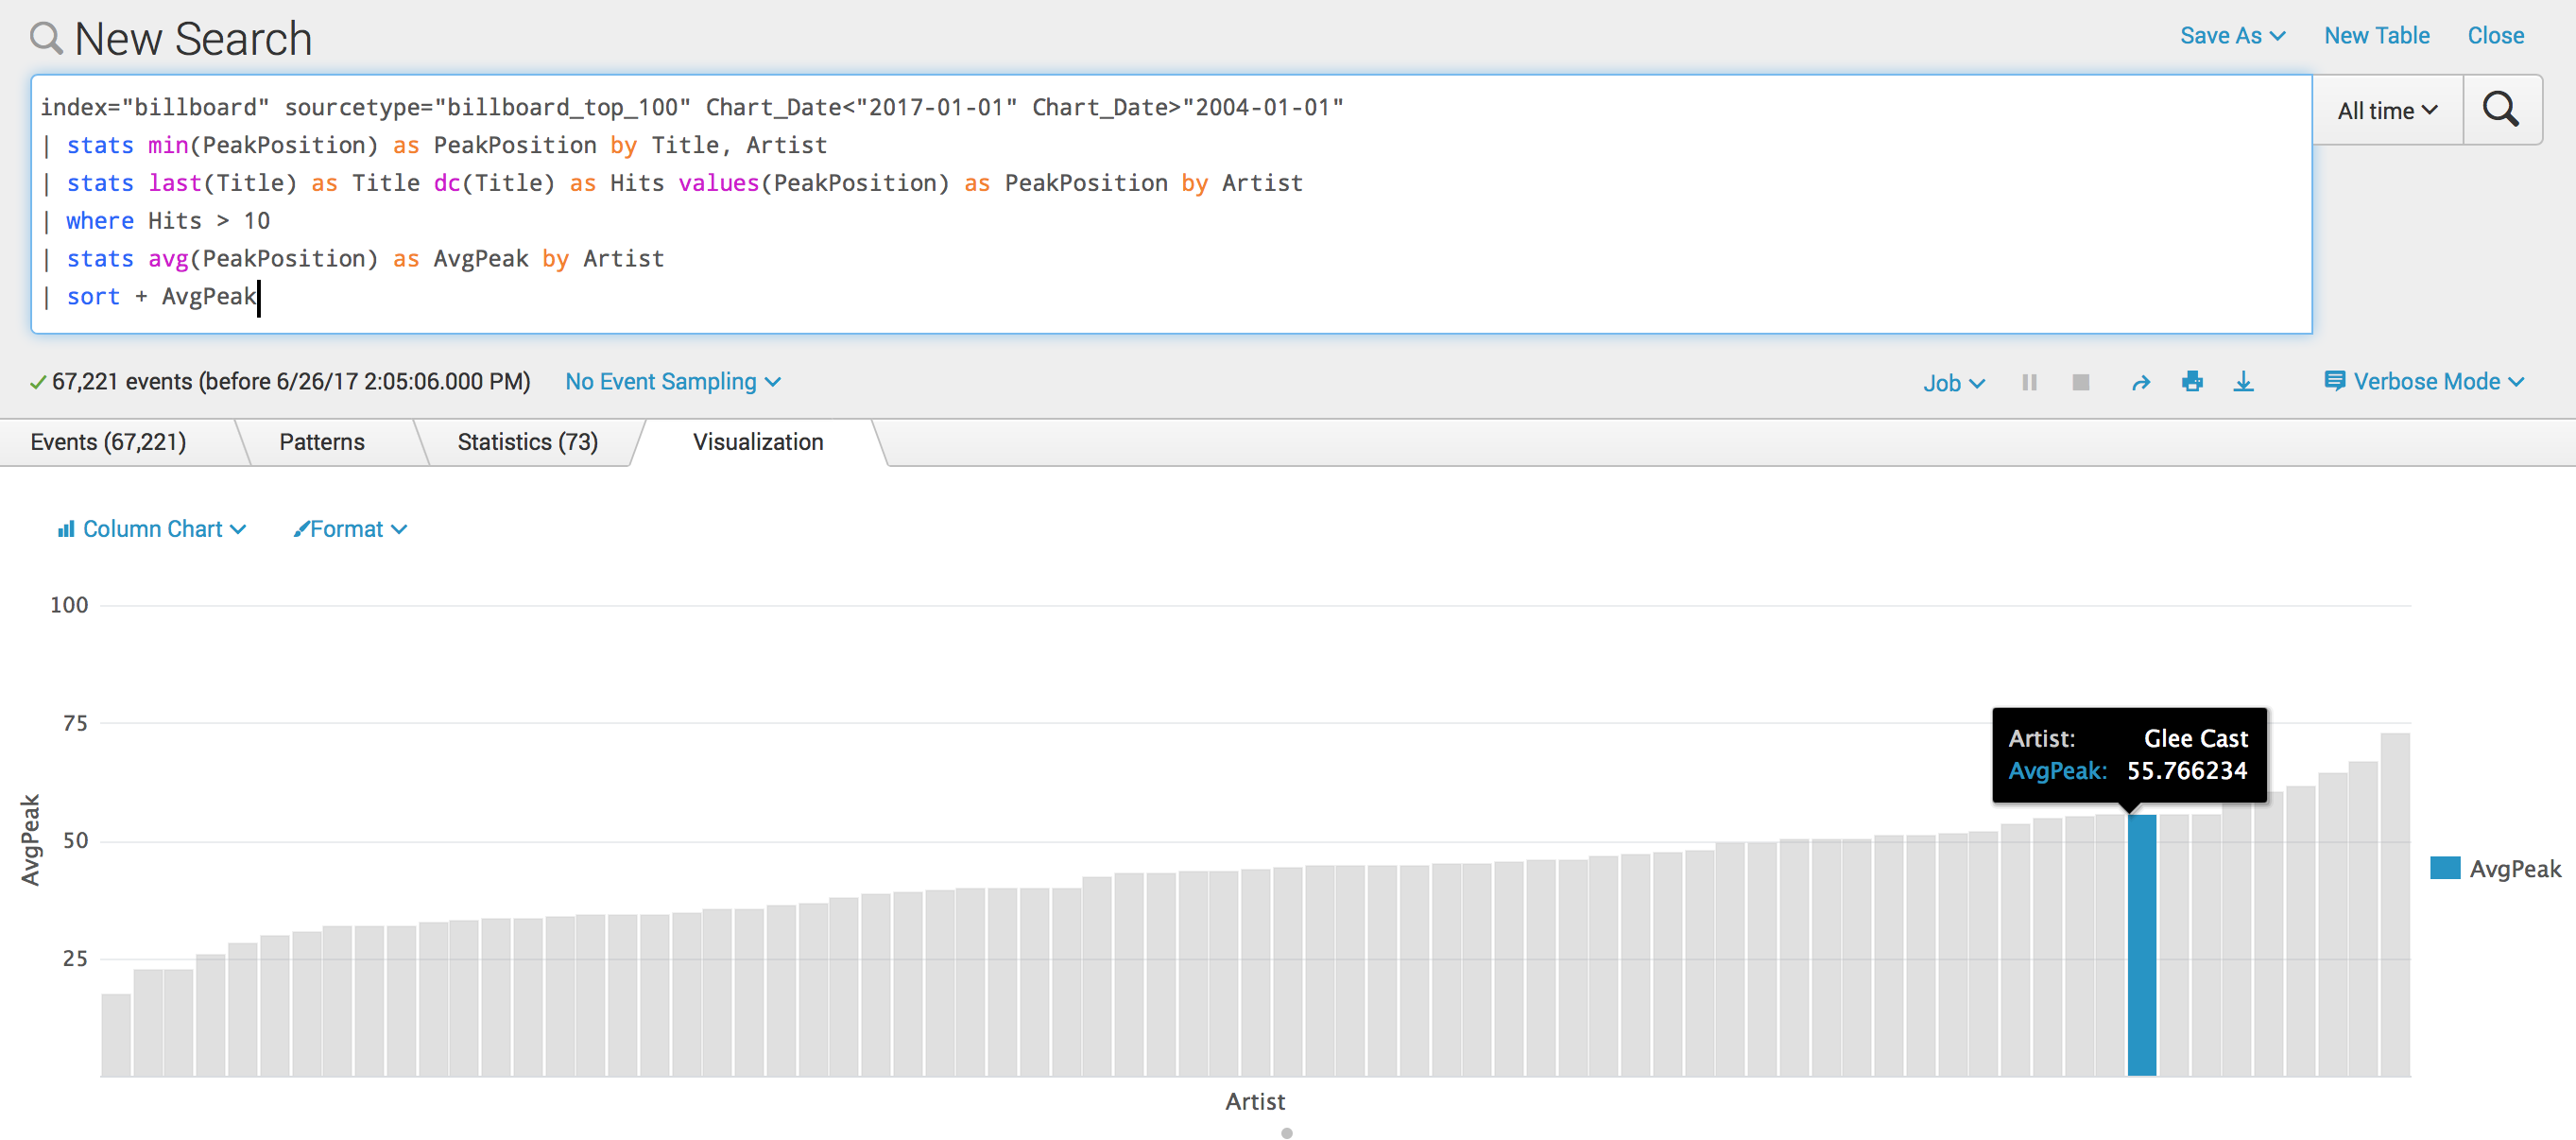
There's a lot of data out there and once we put it into Splunk, there's a lot of interesting information we can pull out of it, so why not have a trip down memory lane and see what sort of songs pop up when going through the Billboard Hot 100 charts from now back to 2000?

First, I found a scraper for the data - thank you Allen Guo for your Billboard charts scraper - and output the data in this format: 

date | title | artist | weeks | delta | current | peak | previous | spotifyID

I did so with this python...


New in Splunk 7.0 – Metrics!

Like most avid Splunk users and admins, our team at Function1 was excited to hear about the release of Splunk 7.0 and all of its powerful new features and enhancements. One of the bigger announcements was Splunk 7.0's debut of a new data type called Metrics.

Splunk’s goal in introducing Metrics is to provide organizations with a highly efficient and scalable method of ingesting, utilizing, and extracting business value out of metrics from critical IT systems.

What are Metrics … and why are they important?

In short, Metrics are numerical values that...


Stay In Touch