Tips & Tricks: Splunk's Monitoring Console

Since Splunk enterprise released 6.5.x "The Distributed Management Console" app was renamed to "The Monitoring Console"; the app name change was not just a rename as the tool got bundled with a number of enhancements. The gist behind the monitoring console is its myriad of dashboards that provides a birds-eye-view health check of a multi-instance Splunk deployment. The dashboards behind the console rely on data collected from the different Splunk Enterprise deployments' internal logs located in both $SPLUNK_HOME/var/log/splunk/ as well as $SPLUNK_HOME/var/log/introspection/. But this blog is not about how to configure the monitoring console whether in a multi-instance or single-instance deployment because there's a ton of info on that on Splunk docs. This blog is about what I found to be the most handy features of the console and what I frequently leverage from the tool.
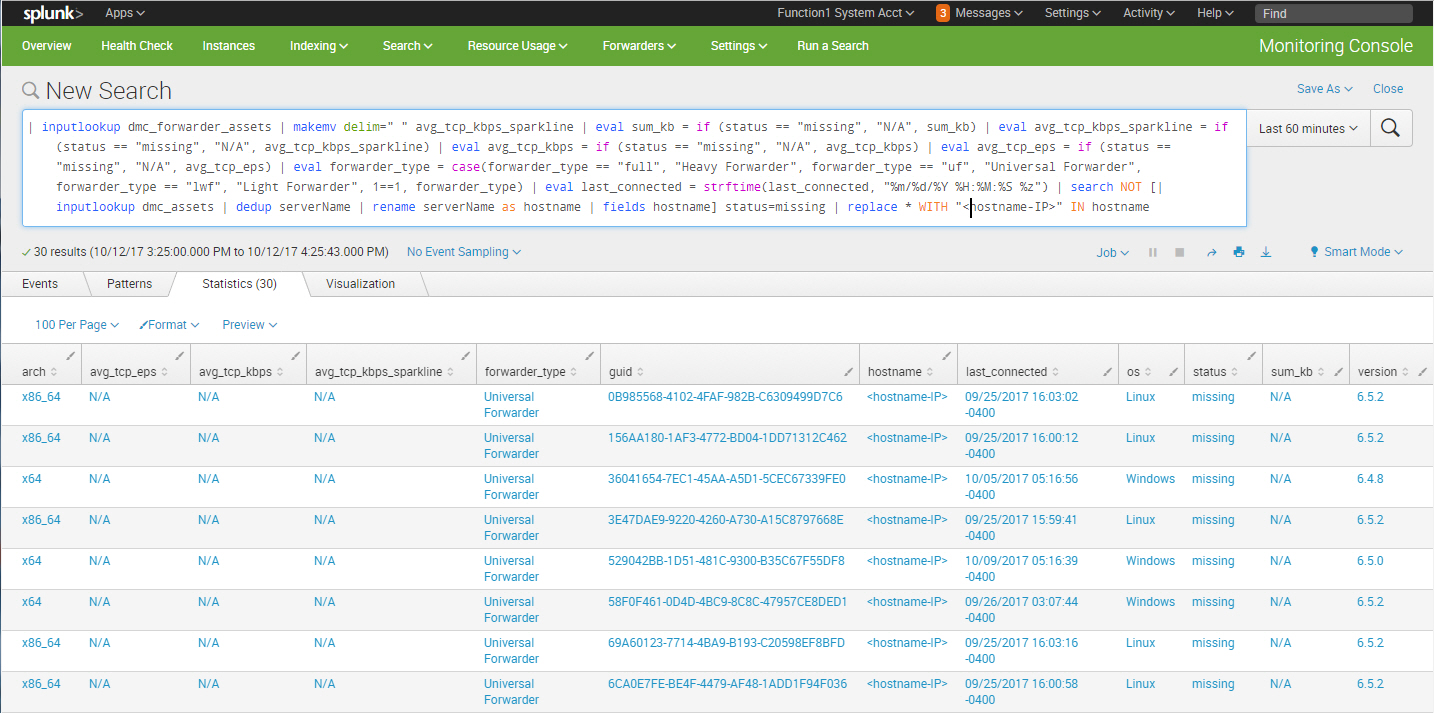
Identify Missing Universal Forwarders
Universal forwarders can fall off the radar for a number of reasons (didn’t restart upon machine startup, machine was decommissioned, etc.) and this search can help identify those that haven’t phoned home for a predefined timeframe:
| inputlookup dmc_forwarder_assets | makemv delim=" " avg_tcp_kbps_sparkline | eval sum_kb = if (status == "missing", "N/A", sum_kb) | eval avg_tcp_kbps_sparkline = if (status == "missing", "N/A", avg_tcp_kbps_sparkline) | eval avg_tcp_kbps = if (status == "missing", "N/A", avg_tcp_kbps) | eval avg_tcp_eps = if (status == "missing", "N/A", avg_tcp_eps) | eval forwarder_type = case(forwarder_type == "full", "Heavy Forwarder", forwarder_type == "uf", "Universal Forwarder", forwarder_type == "lwf", "Light Forwarder", 1==1, forwarder_type) | eval last_connected = strftime(last_connected, "%m/%d/%Y %H:%M:%S %z") | search NOT [| inputlookup dmc_assets | dedup serverName | rename serverName as hostname | fields hostname] status=missing
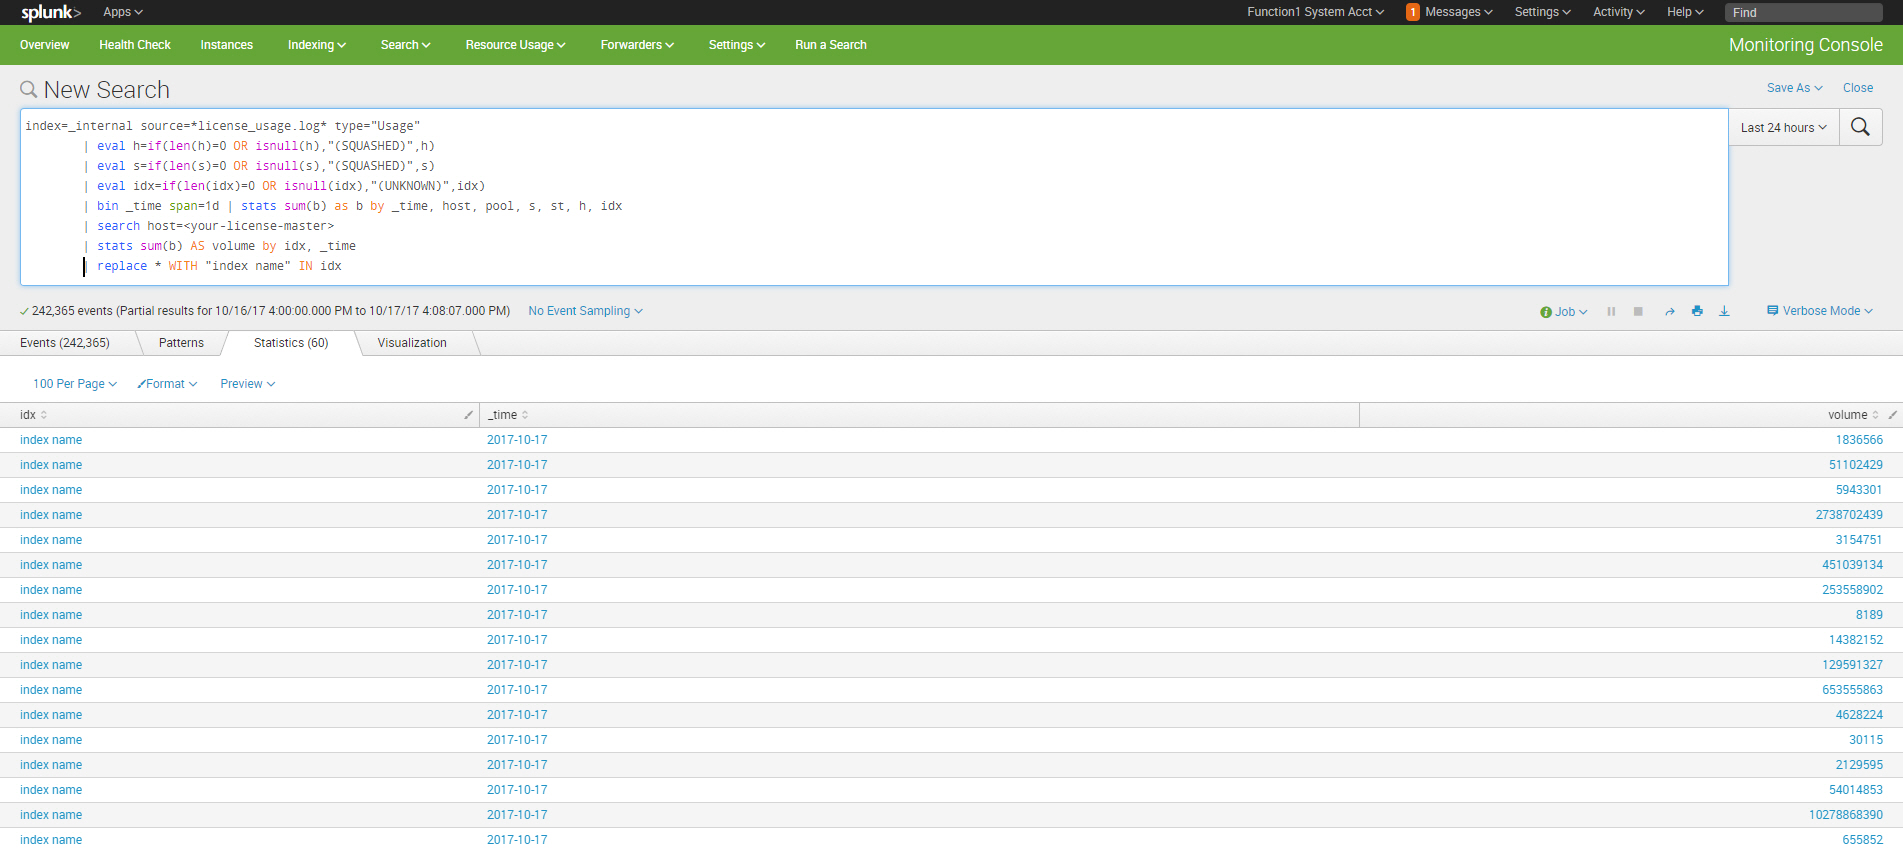
Identify Growing Indexes
index=_internal source=*license_usage.log* type="Usage" | eval h=if(len(h)=0 OR isnull(h),"(SQUASHED)",h) | eval s=if(len(s)=0 OR isnull(s),"(SQUASHED)",s) | eval idx=if(len(idx)=0 OR isnull(idx),"(UNKNOWN)",idx) | bin _time span=1d | stats sum(b) as b by _time, host, pool, s, st, h, idx | search host=<your-license-master> | stats sum(b) AS volume by idx, _time | replace * WITH "index name" IN idx
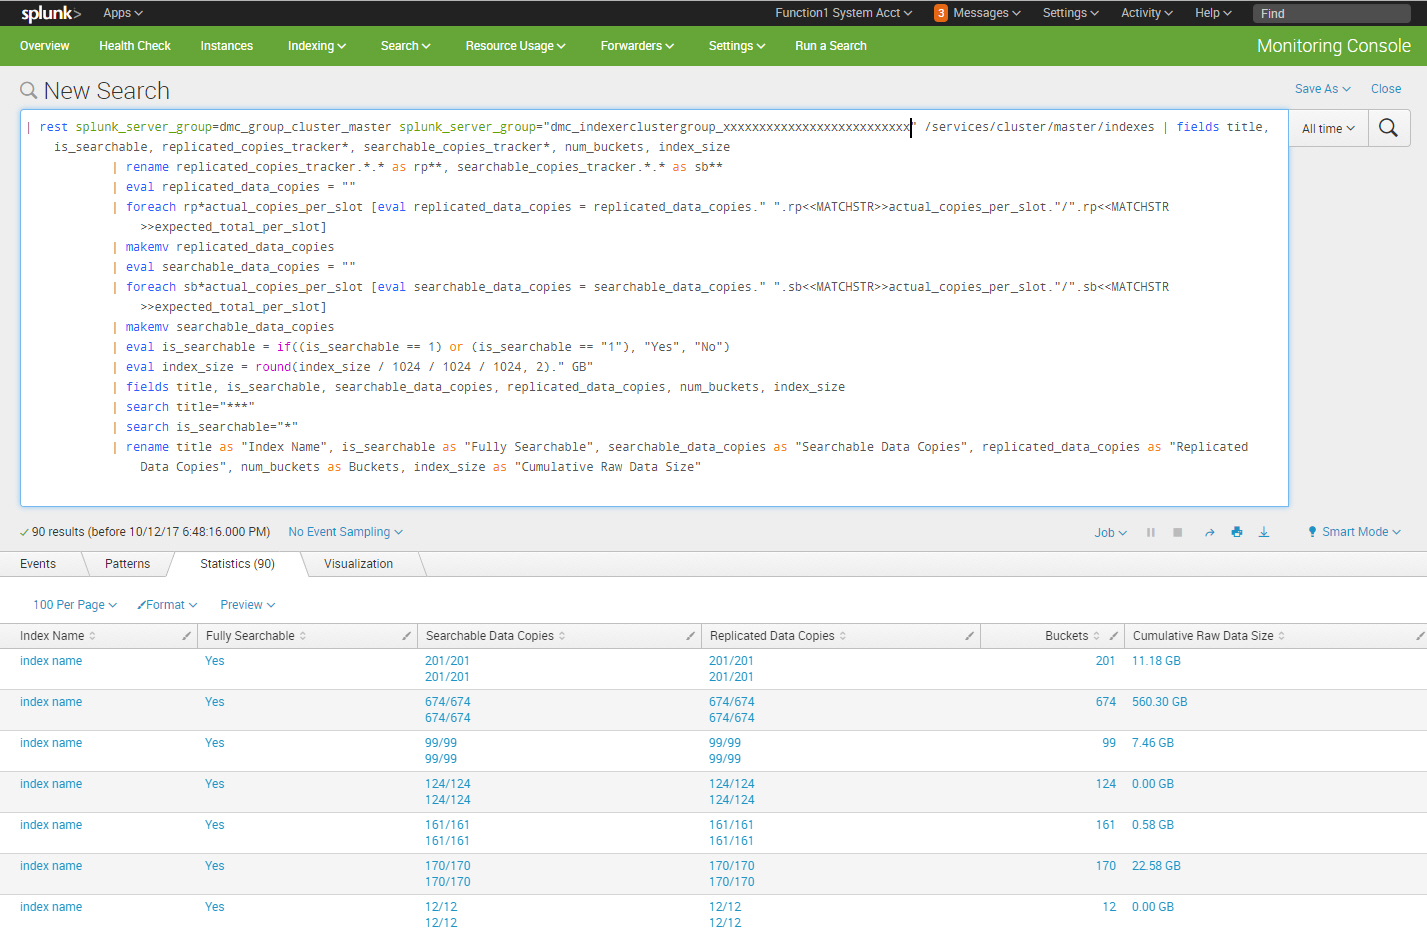
Identify Indexes Physical Storage
Over time the size of the raw data size in each Splunk index bucket, especially cold buckets, will grow and consume disk storage. As Splunk admins, we need to keep an eye on the underlying physical disk storage utilization and this search identifies the consumed physical storage for each index:
| rest splunk_server_group=dmc_group_cluster_master splunk_server_group="dmc_indexerclustergroup_xxxxxxxxxxxxxxxxxxxxxxxxxx" /services/cluster/master/indexes | fields title, is_searchable, replicated_copies_tracker*, searchable_copies_tracker*, num_buckets, index_size | rename replicated_copies_tracker.*.* as rp**, searchable_copies_tracker.*.* as sb** | eval replicated_data_copies = "" | foreach rp*actual_copies_per_slot [eval replicated_data_copies = replicated_data_copies." ".rp<<MATCHSTR>>actual_copies_per_slot."/".rp<<MATCHSTR>>expected_total_per_slot] | makemv replicated_data_copies | eval searchable_data_copies = "" | foreach sb*actual_copies_per_slot [eval searchable_data_copies = searchable_data_copies." ".sb<<MATCHSTR>>actual_copies_per_slot."/".sb<<MATCHSTR>>expected_total_per_slot] | makemv searchable_data_copies | eval is_searchable = if((is_searchable == 1) or (is_searchable == "1"), "Yes", "No") | eval index_size = round(index_size / 1024 / 1024 / 1024, 2)." GB" | fields title, is_searchable, searchable_data_copies, replicated_data_copies, num_buckets, index_size | search title="***" | search is_searchable="*" | rename title as "Index Name", is_searchable as "Fully Searchable", searchable_data_copies as "Searchable Data Copies", replicated_data_copies as "Replicated Data Copies", num_buckets as Buckets, index_size as "Cumulative Raw Data Size"
As you can see, the monitoring console is bundled with a number of handy and complex searches out-of-the-box. So before you start Googling how to perform a certain ad-hoc health check function in your Splunk deployment, see if you can locate a search or an alert buried somewhere in the monitoring console dashboards that you can perhaps make use of and even build on and customize for your use case.
Thanks for reading.
- Log in to post comments
