Using Splunk to Analyze New York City Uber Data

It’s fun getting all types of data into Splunk, analyzing it, and learning something new. I was pretty excited when I found this Uber trip data from FiveThirtyEight with 4.5 million records of Uber pickups from April - September 2014. Uber also debuted Uber Movement which is offering access to their data if you get on a waiting list. If you are interested in Uber data, you should definitely check that out.
Besides the Subway, and other rideshare services like Lyft, Uber is a pretty common way to get around New York City.
In this blog post, I'll index this sample data in Splunk to see if I can learn something interesting from it. The data also has longitude and latitude info, so I will plot it on a map using Clustered Single Map Visualization to get location-based insight.
Anyway, let’s get started!
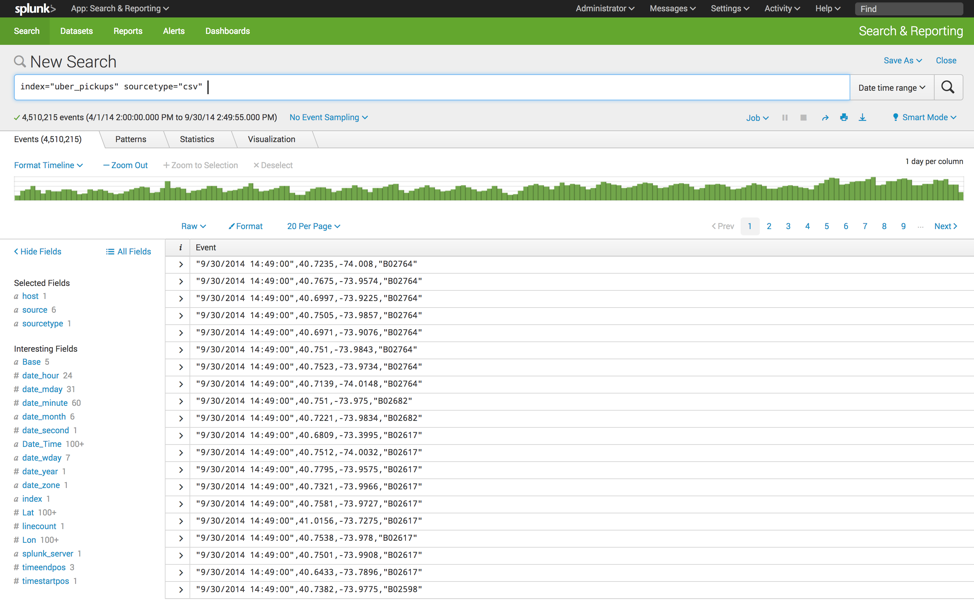
Getting the data into Splunk is just a matter of uploading the csv file. As you can see (below), Splunk is able to automatically extract fields by using information in the file header e.g. timestamp, Lat and Lon fields.
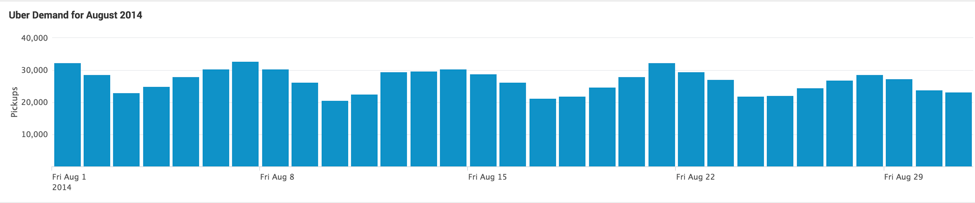
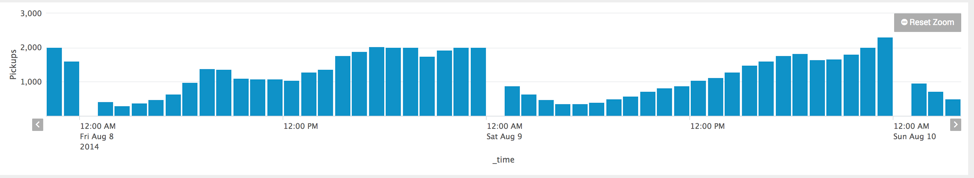
So, now that I have the data indexed, let's find out the busiest days for pickup. Below, I narrowed down the data search to August 2014 to get an idea of busiest days for that month.
Looking at the column chart I can see that the busiest days are Thursdays, Fridays, and Saturdays. The least-busy days are Sundays and Mondays.
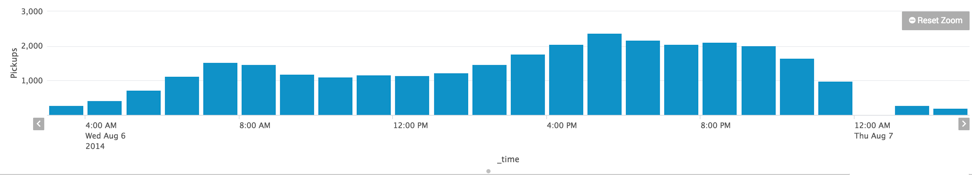
Now, let’s take a closer look and identify the busiest hours.
Monday through Wednesday, the pattern is pretty similar with pickups peaking around 7am – 8 am and then again at 5pm. Pickups drop the later it gets. Makes sense for a typical work day.
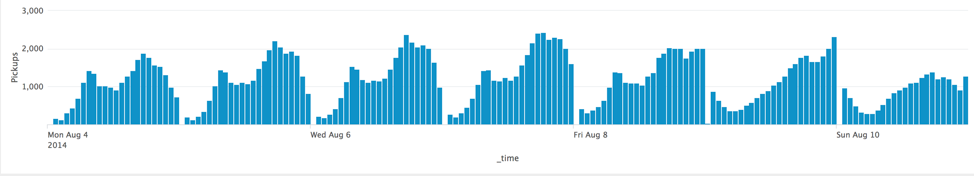
Friday and Saturday share a similar pattern as well, pickups increase the later it gets - peaking around 11pm - drop off dramatically at midnight, and then increase again at 1am.
Now, let's plot the pickups on a map to see if we can learn anything interesting from the data based on location.
For example: where is everyone hanging on a typical Saturday night?
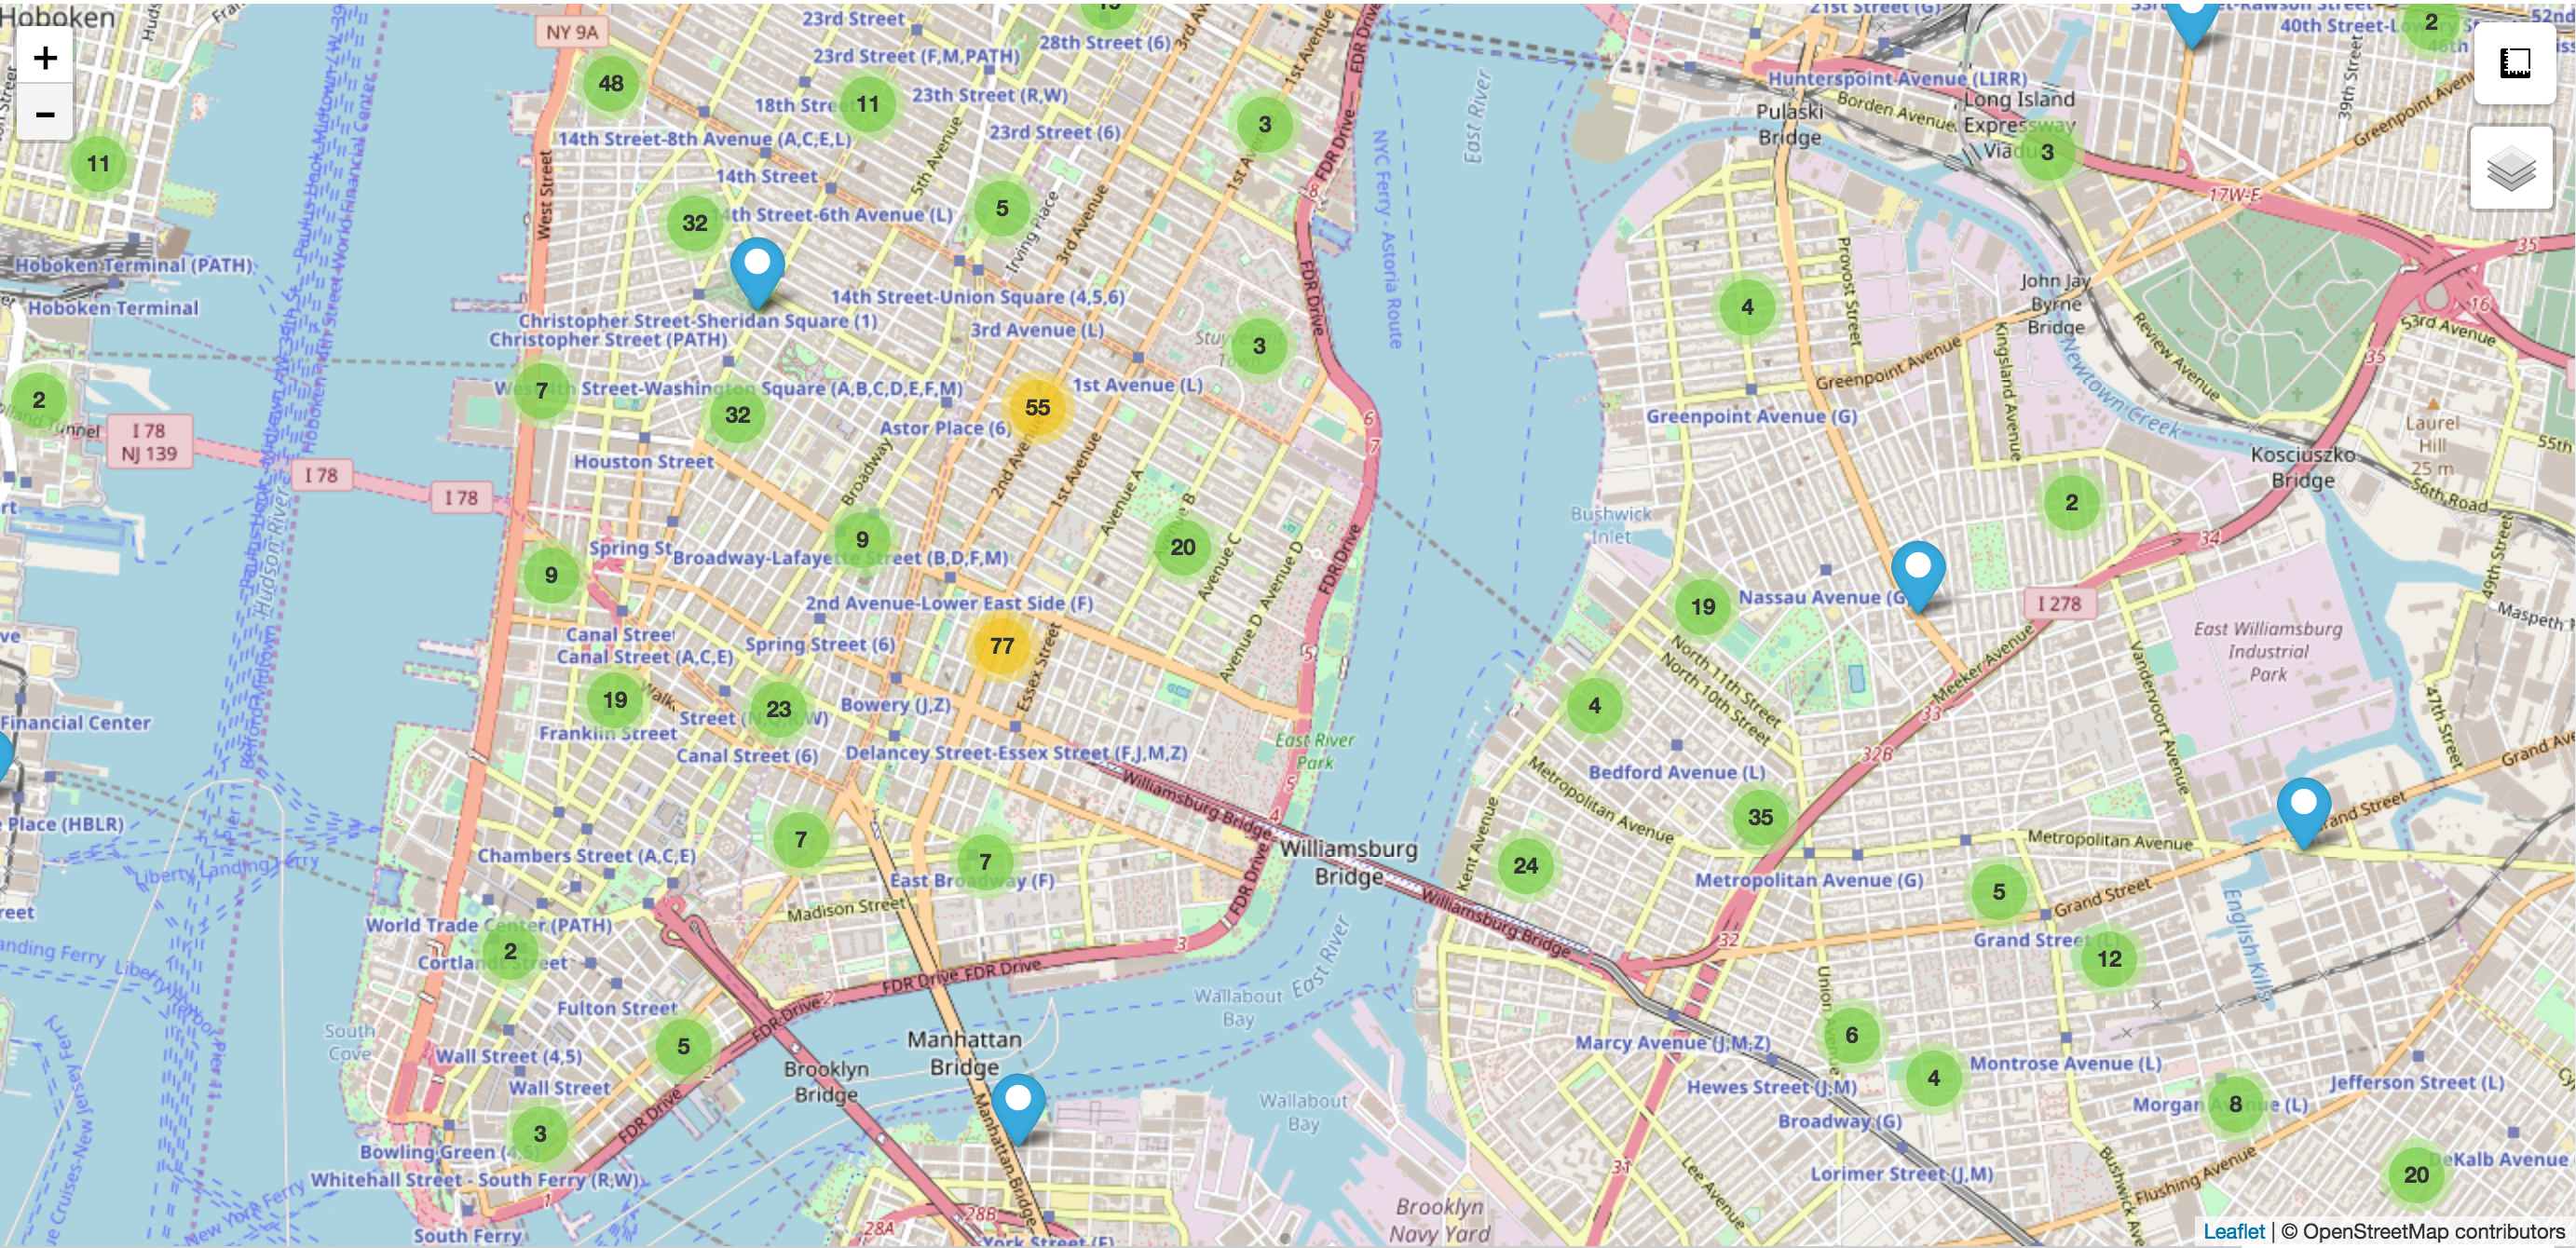
I looked at all weekends in August 2014 to discover which neighborhoods had the most pickups between 1am - 3am (since this is typically when people start leaving their hangout spots to head back home).
Looking at the map, we can see the most active neighborhoods for nightlife are Manattan's Lower East Side, East Village, Meatpacking, and Hell's Kitchen. In Brooklyn, it's the Williamsburg area.
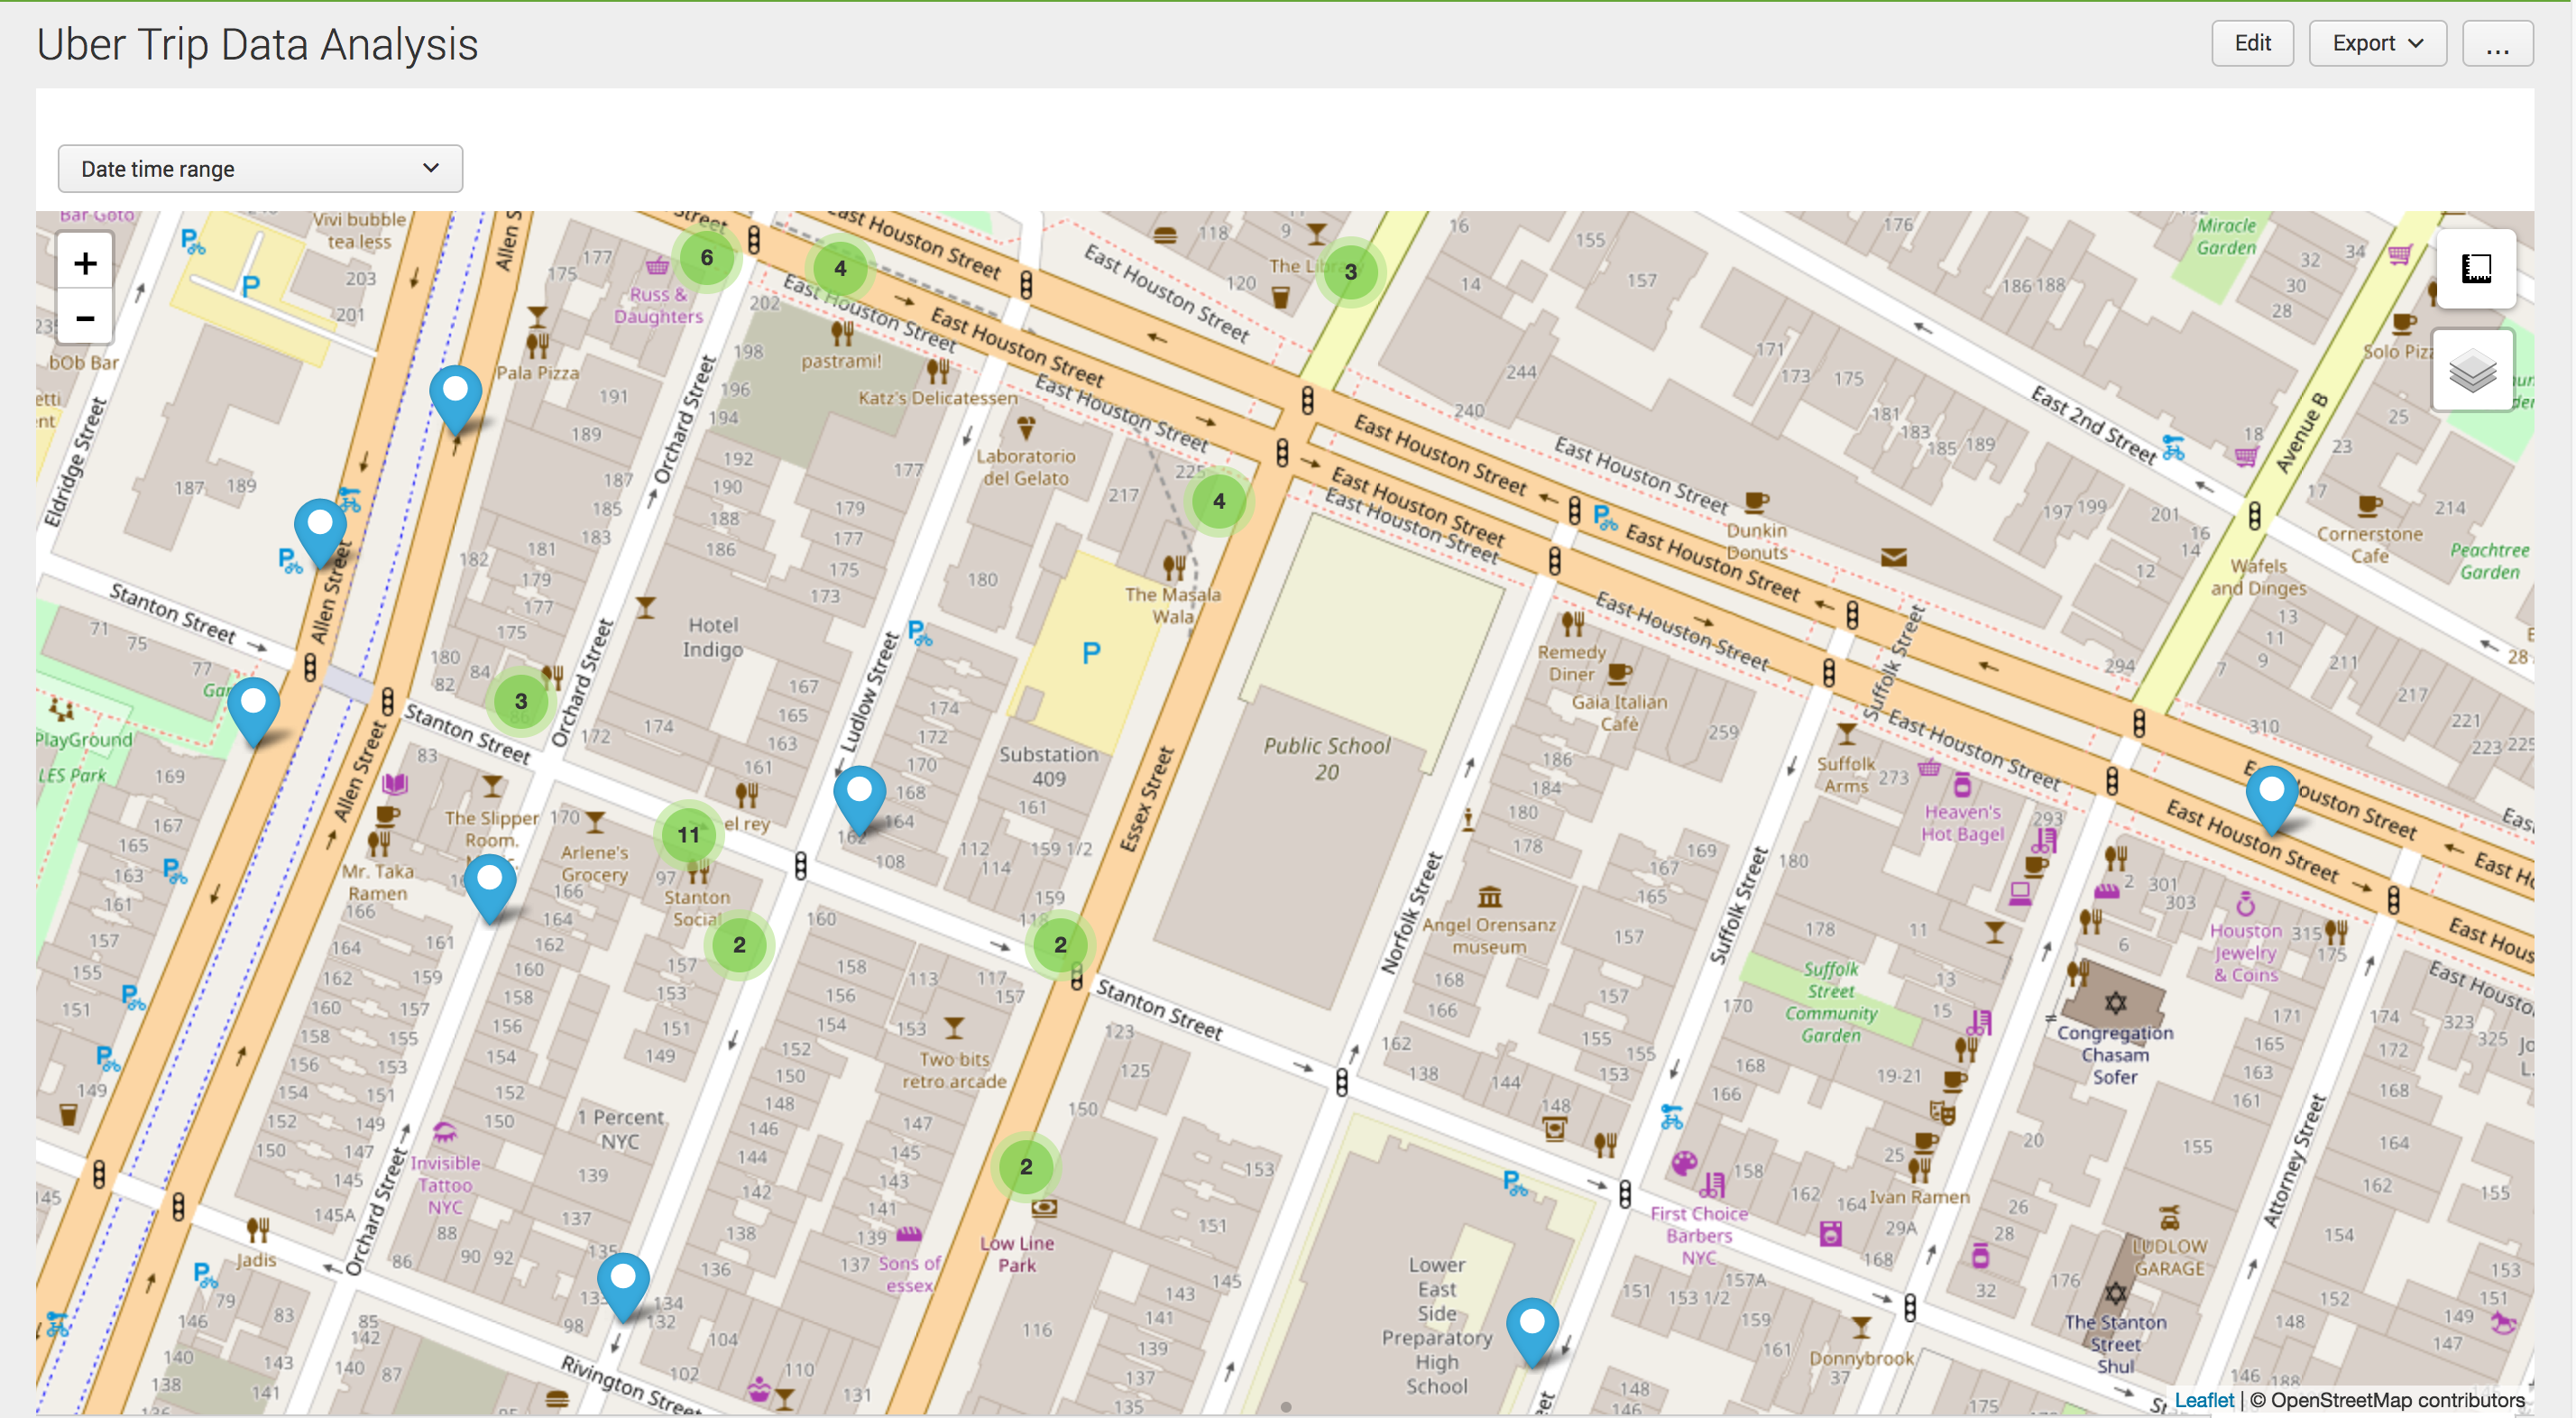
Since the Lower East Side consistently has the most pickups for that month, I took a closer look to figure out where exactly everyone's hanging out. Zooming in a bit, the most popular hangout spot in the Lower East Side alternates between The Stanton Social, The Slipper Room, and Spitzer's Corner.
Pretty cool, huh?
Happy Splunking!
- Log in to post comments
