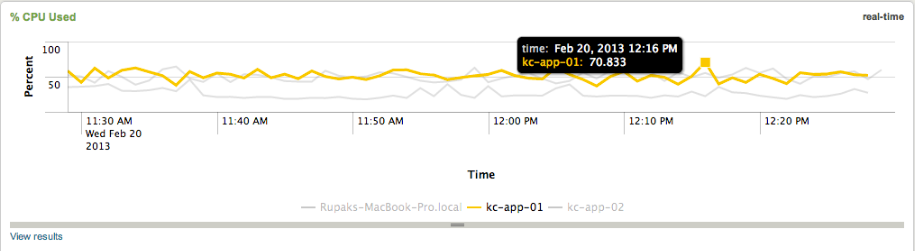
System monitoring dashboards are something we are often asked to provide for our clients. Normally, this is a pretty straight forward task, but on a recent client engagement, I was presented with one requirement that was a bit out of the ordinary. This client was looking to monitor a set of ten desktops with a real-time dashboard that would display in their office. They wanted to see all of the standard metrics like cpu, memory, and disk. If there was a spike in a time chart for say % CPU Usage, they wanted to be able to click on the spike and drill down into another view. They wanted the...
Passing Time
Posted by Rupak Pandya
on Thursday, April 4, 2013 - 13:00
Operational Intelligence, Best Practices Best Practices, Big data, Machine data, props.conf, Splunk, Web Analytics, XML