Enhance your WCS Dashboard Widgets with D3.js
As far back as I can remember, WebCenter Sites' Contributor UI dashboard widgets have been simple HTML tables full of text. Behold, D3.js, a JavaScript library that helps "bring your data to life" and easily create animated graphics.
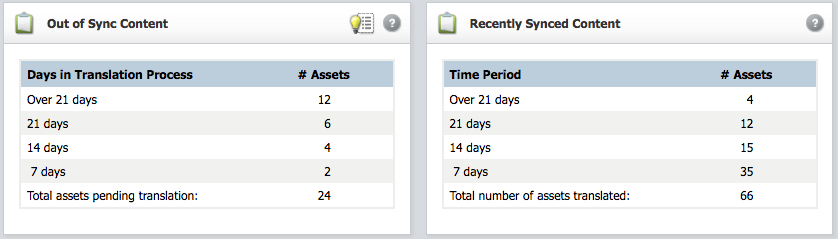
A good use case for this is the two dashboard widgets that come with Function1's LingoTek inside WebCenter Sites product (pictured below), which simply show some numbers about recent activity between WCS and Lingotek.
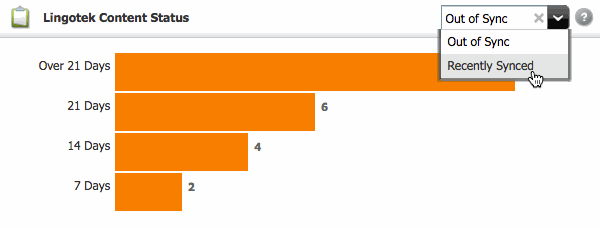
These widgets work just fine. But with D3, we can convert them into bar charts that are much easier to read. In this post, we'll create a single dashboard widget that combines both of these widgets into a single widget that displays the same data as bar charts. It'll display one chart at a time, with a dropdown that lets you toggle between the two. And the coolest part is the animation effects when toggling between the two charts.
Before we dig into the code, here's what the final widget will look like.
First, let's register a new dashboard widget in CustomElements/UI/Layout/CenterPane/DashBoardContentsConfig.
<component id="lingotekD3Widget">
	<id>lingotekD3Widget</id>
	<name>Lingotek Content Status</name>
	<url>CustomElements/UI/Layout/CenterPane/DashBoard/LingotekD3Widget</url>
	<height>160px</height>
	<closable>false</closable>
	<open>true</open>
	<dragRestriction>false</dragRestriction>
	<style>assignmentPortlet</style>
	<column>1</column>
</component>
[
  {
    "id": "outOfSync",
    "desc": "Out of Sync",
    "data": [
      {
        "key": "over_21_days",
        "count": 12,
        "description": "Over 21 Days"
      },
      {
        "key": "21_days",
        "count": 6,
        "description": "21 Days"
      },
      {
        "key": "14_days",
        "count": 4,
        "description": "14 Days"
      },
      {
        "key": "7_days",
        "count": 2,
        "description": "7 Days"
      }
    ]
  },
  {
    "id": "recentlySynced",
    "desc": "Recently Synced",
    "data": [
      {
        "key": "over_21_days",
        "count": 4,
        "description": "Over 21 Days"
      },
      {
        "key": "21_days",
        "count": 12,
        "description": "21 Days"
      },
      {
        "key": "14_days",
        "count": 15,
        "description": "14 Days"
      },
      {
        "key": "7_days",
        "count": 35,
        "description": "7 Days"
      }
    ]
  }
]
Next, in the LingotekD3WidgetHtml, let's first add the HTML:
<div data-dojo-type="dijit.layout.BorderContainer" data-dojo-props="'class':'fwPortletContainer'">
	<span data-dojo-type="dijit.layout.ContentPane" data-dojo-props="region:'top','class':'portletTitleButtons'">
		<select id="d3LingotekSelectData" dojoType="fw.dijit.UISimpleSelect" style="width:auto;" onChange="return menuClick();" showErrors="false" clearButton="true" name="lingoWidgetSelect" size="1">
			<option value='outOfSync' selected="selected">Out of Sync</option>
			<option value='recentlySynced'>Recently Synced</option>
		</select>
		<span id="d3LingotekHelp" data-dojo-type="dijit.form.Button"
			><img src="wemresources/images/ui/ui/dashboard/helpIcon.png" height="26" width="26" alt="help" title=""
		/></span>
		<span data-dojo-type="fw.ui.dijit.HoverableTooltip" data-dojo-props="connectedNodes:'d3LingotekHelp', position:'below','class':'helpTextTooltip'">
			<strong>Lingotek Content Status</strong><br />
			This widget displays the out of sync and recently synced Lingotek status as a neat D3.js graphic with animated transitions.
		</span>
	</span>
	<div id="d3WidgetBody">
		<div id="d3LingotekChart"></div>
	</div>
</div>
A few things to note in the HTML: Lines 3-6 create the select input that lets us toggle between the two graphs that will be displayed -- Out of Sync and Recently Synced. Lines 7-13 create the help icon and tooltip that appears in the top-right of the widget. And lines 15-17 are the placeholder DIVs that will hold the D3 graphs.
Next, let's add in all the JavaScript. Note, the first line is including the D3 library. Here we are using D3 version 4.2.6.
<script type="text/javascript" src="/d3/d3.min.js"></script>
<script>
var barHeight = 40, width = 300, parameter = 'count', menuSelected = 'outOfSync';
var defaultMenu = "outOfSync";
var data = [], xScale = null;
var allData = [];

//*** HELPER FUNCTIONS ***
function px(s) {
   return s + 'px';
}

//*** JSON DATA FUNCTIONS ***
// Returns the JSON data for a particular bar graph
function getDataForGraph(graphId) {
  var selectedData;
  for (i in allData) {
   var graph = allData[i];
   if (graph.id == graphId) {
    selectedData = graph.data;
   }
  }
  if (!selectedData) {
   selectedData = allData[0].data;
  }
  return selectedData;
}

//*** UI ***
// this is the 'onChange' event handler for the SELECT dropdown
function menuClick() {
  // get the 'id' of the new bar chart to display
  var optionSel = dijit.byId("d3LingotekSelectData");
  if(menuSelected === optionSel) {
   return;
  }

  // get data for new bar chart
  data = getDataForGraph(optionSel);

  // call method to update the display
  updateChart();
}


//*** D3 ***
function updateScale() {
   xScale = d3.scaleLinear()
     .domain([0, d3.max(data, function(d) { return d[parameter]; })])
     .range([0, width]);
}

// Updates the display with a different bar chart.
// Both the bar graphics and text counts will animate
// when transitioning to the new chart
function updateChart() {
  // updates the X-scale for the bar chart display
  updateScale();

  // set the bar graphics with the new data and transition to them
  d3.select('#d3LingotekChart')
   .selectAll('div.bar')
   .data(data)
   .transition()
   .duration(1000)
   .style('width', function(d) {
    return px(xScale(d[parameter]));
   });

  // set the text values in the bar chart and transition to them
  d3.select('#d3LingotekChart')
   .selectAll('div.value')
   .data(data)
   .transition()
   .duration(1000)
   .tween("text", function(d) {
    var interpolate = d3.interpolateRound(this.textContent, d[parameter]);
    var node = this;
    return function(d3_t) {
     node.textContent = interpolate(d3_t);
    };
   });
}

function initializeChart() {
  // get data just for the selected menu
  data = getDataForGraph(defaultMenu);
  // set the proper scale for the bar graphics (method 'xScale' below)
  updateScale();

  // create 'category' divs. Each of these is one row in the bar chart
  var categories = d3.select('#d3LingotekChart')
   .selectAll('div')
   .data(data)
   .enter()
   .append('div')
   .classed('category', true)
   .style('top', function(d, i) {
    return px(i * barHeight);
   });

  // add label div to each 'category'
  categories.append('div')
   .classed('label', true)
   .text(function(d) {return d.description;});

  // add bar graphic div for each 'category'
  categories.append('div')
   .classed('bar', true)
   .style('height', px(barHeight * 0.95))
   .style('width', function(d) {
    return px(xScale(d[parameter]));
   });

  // display number value next to each 'category' bar
  categories.append('div')
   .classed('value', true)
   .text(function(d) {return (d[parameter]);});
}

//*** MAIN CODE TO RUN ON LOAD ***
// call CSElement to load the JSON data for the widget
<render:callelement elementname="CustomElements/UI/Layout/CenterPane/DashBoard/LingotekD3WidgetAction" scoped="global" />
// store data for all bar charts in 'allData' var
allData = JSON.parse('<%=ics.GetVar("d3WidgetJson")%>');
// initialize the display
initializeChart();
</script>
I won't go through this line by line, but in short,
- The data for ALL the bar charts is loaded into variable allData
- initializeChart() is called to initialize the display
- when you use the dropdown input to select a different graph to display, menuClick() and updateChart() process the input event and display the new bar chart using some nice animation effects
And finally, you need some CSS styling.
<style>
#d3WidgetBody div.category {
position: absolute;
}

#d3WidgetBody div.label {
float: left;
width: 95px;
font-size: 12px;
text-align: right;
padding: 4px 5px 0 0;
color: #333;
}

#d3WidgetBody div.bar {
float: left;
background-color: #ff7b12;
}

#d3WidgetBody div.value {
float: left;
padding: 6px 0 0 6px;
font-size: 11px;
font-weight: bold;
color: #666;
}
</style>
And that's it! Tools like this can make a WCS dashboard much more usable for your end users, and thats a good thing.
- Log in to post comments
