Introduction to Drupal 7 Maps - OpenLayers
This article is the first in a series on mapping in Drupal. There are a few online tutorials on using OpenLayers in Drupal but successful implementations are still hard to achieve for many. We’re going to start with the simplest possible implementation using OpenLayers.
Modules Required
First, the obvious module: OpenLayers. And then the OpenLayers Dependencies:
● Libraries - this gives us easy access to external libraries.
● Proj4js - a library which provides support for reprojecting coordinates
● CTools - a very useful suite of APIs and tools that you probably have installed already
● Views - you likely have this module too. It requires CTools also
● geoPHP - Drupal integration with the open source PHP library for geometry operations
● Geolocation - One concession to make things easier. This module provides a Drupal 7 field that stores Latitude/Longitude pairs
There are other modules that can add additional features to maps or just make the set up more dynamic but these are all that are actually needed.
Drupal Components That Make Up a Map
To visualize how OpenLayers creates a map, think of overhead transparencies. Many of us remember dimly light classes with a professor shuffling mixed up transparent sheets of cellulose acetate before laying them upside down on an overhead projector. OpenLayers works the same way although, fortunately for us, it is a lot more organized.
We use the OpenLayers Admin to create new maps, choose which layers you display and configure the capabilities and behaviors you want to be available.
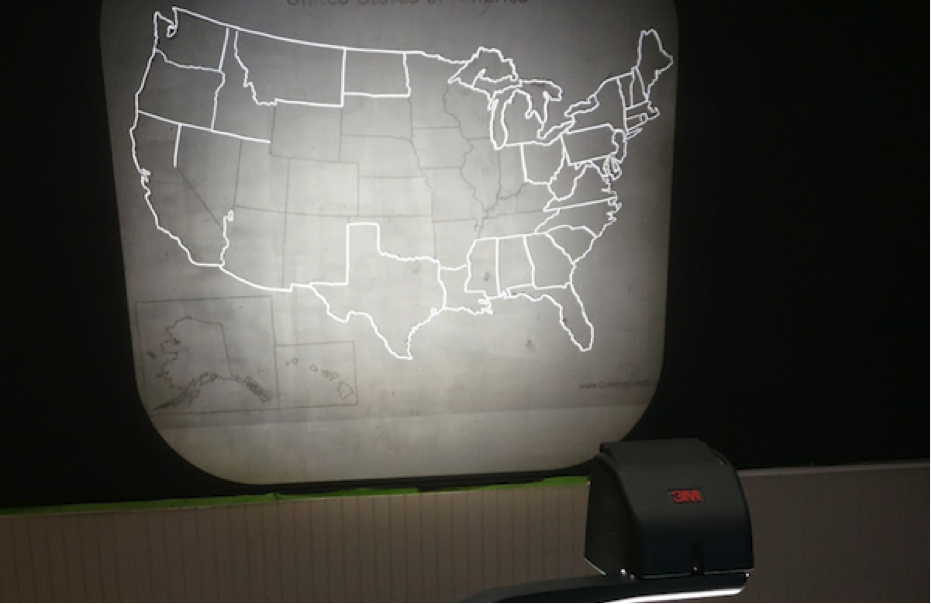
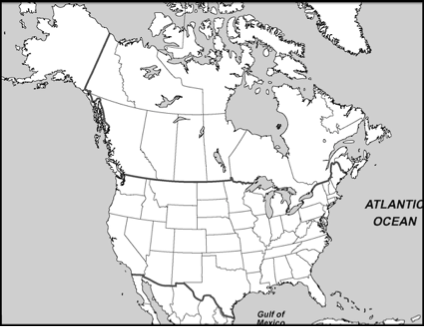
In displaying a map, OpenLayers needs at least two layers. The first layer, called the base layer, makes up the body of the map (Figure 1). You choose the base layer in the OpenLayers admin. The second, and any subsequent layers, are also defined in your view (Figure 2). These layers determine the data that is displayed.
Data First
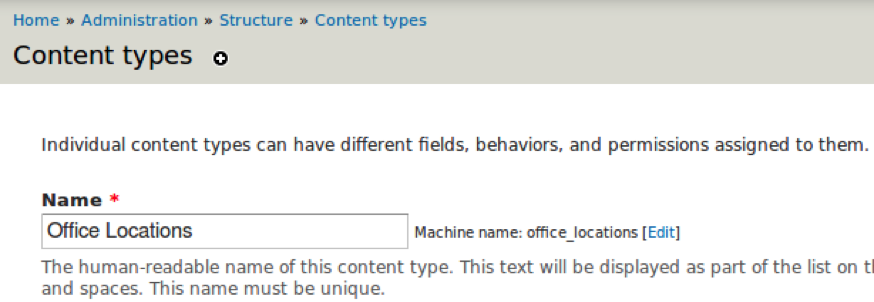
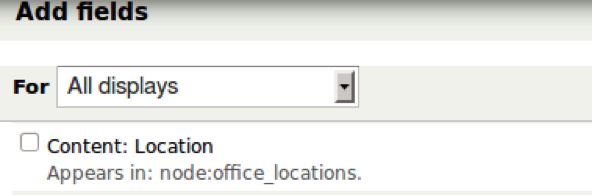
As tempting as it is to dive into the creation of a map layer, you first need to create some data to display. For the purposes of this article we will take the simplest approach and create a content type type with and add a geolocation (latitude/longitude) field.
If you have an existing content type that you would like to display on a map, go ahead and add a geolocation field to it.
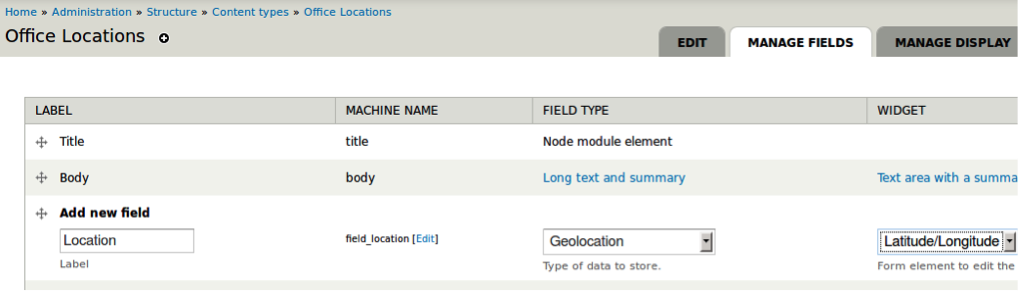
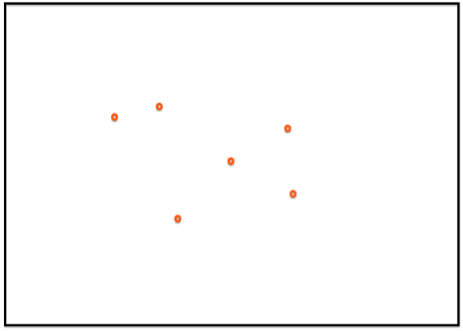
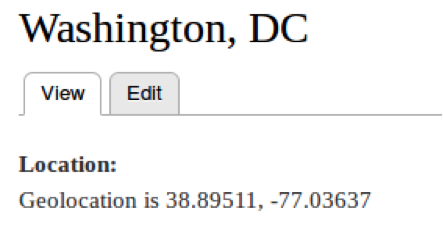
Once you have a content type with a geolocation field, create a node or two. For example, I’ve created a node for our Washington, DC office. I looked up the lat/long decimal coordinates.
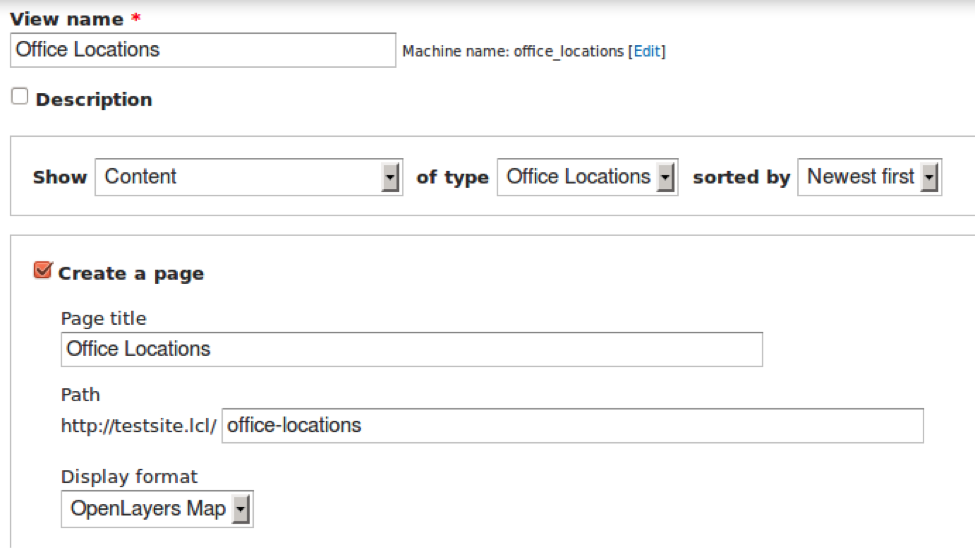
Create a View
OpenLayers adds new options to the Views module allowing you to create a view with the format OpenLayers Map. This can be confusing since you can’t actually see the result of the view. That’s because the view in this format is simply used to pull the data you need from nodes. As is typical in views, you can also set filters, number of items to display, etc but once again nothing is visible just yet.
Create a new view. Select show content of type Office Locations. For the sake of simplicity we will create this view with a display page. Finally choose the display format OpenLayers Map.
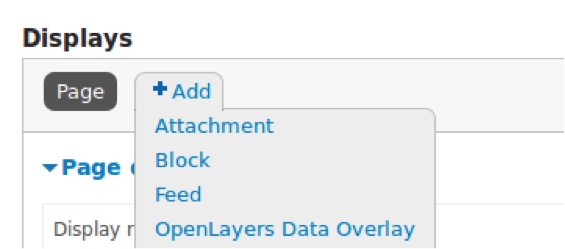
You could click Save & Exit and jump over to the OpenLayers admin to start configuring your new map now. Instead, since we’re already in the view, let’s click Continue & Edit so we can add a Data Overlay layer.
In the view, click Add and choose OpenLayers Data Overlay.
Then select the type of Data Overlay you would like. In our case, we’ll use the Vector Data Overlay. Be sure to change the display to This openlayers (override).
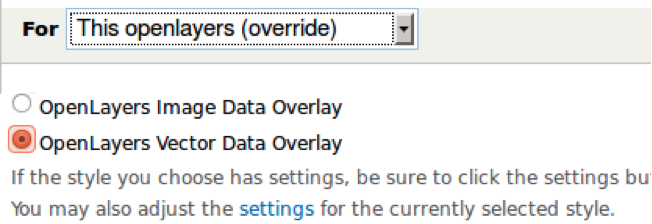
The Data Overlay is going to need to know what field(s) contain the location information for the map points. Since we have a single field for both the latitude and longitude and have avoided other helper modules, we’ll need to add the location field twice.
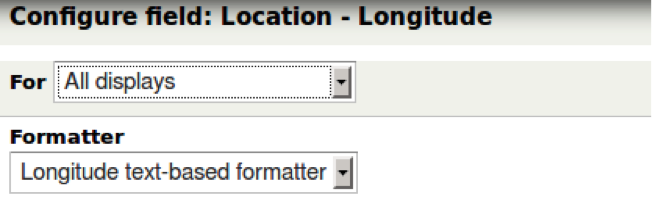
The first time you add the location field, choose the Latitude text-based formatter.
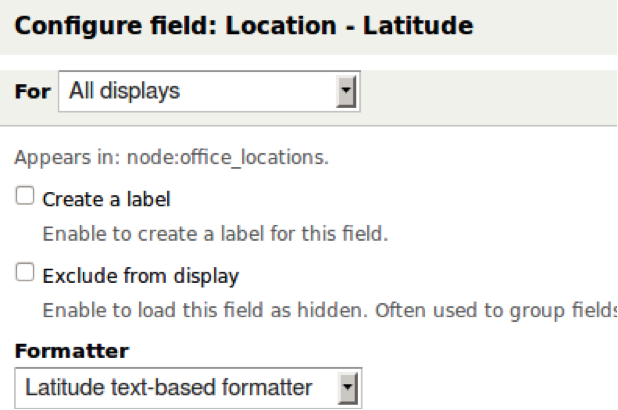
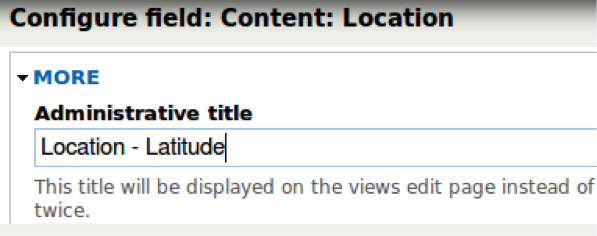
For ease of recognition later you can update the administrative title on each of the Location field instances to specify which one you are using for latitude and longitude.
The second time you add the location field, choose the Longitude text-based formatter.
Once you’ve added both the latitude and longitude fields you can adjust the settings of the Data Overlay Layer. Set the Map Data Sources to Lat/Lon Pair. Set the Latitude and Longitude Fields to the appropriate fields you’ve added.
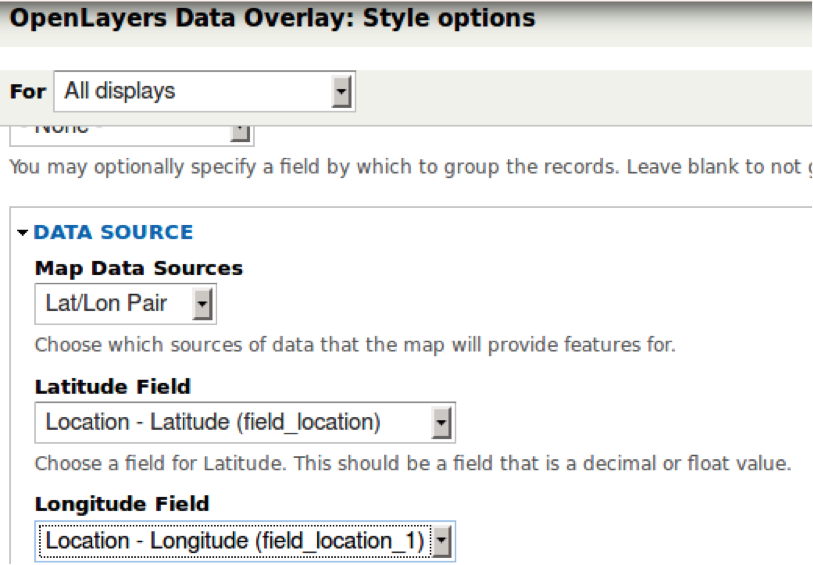
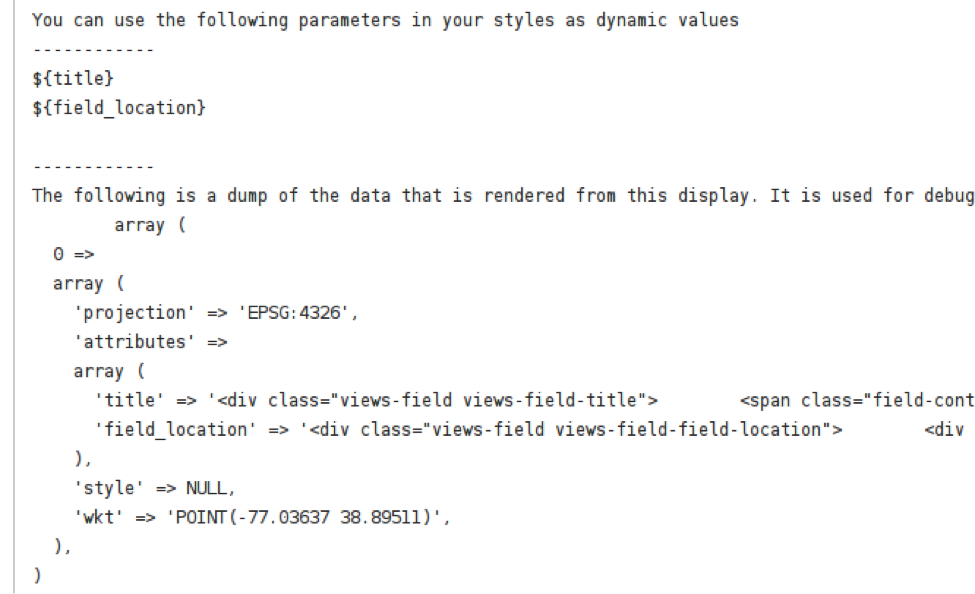
Once the fields are set you can verify that lat/long data is being returned by scrolling down to the preview on the Data Overlay part of the view.
Putting it All Together
Now you have the building blocks to put together a map using the OpenLayers Admin. You should have:
● some data to display stored in the geolocation field of your content type
● a view with a display format of OpenLayers Map
● a Data Display Layer in your view
We will revisit the configuration of this view in a minute but first we need to create a new map in the OpenLayers Admin.
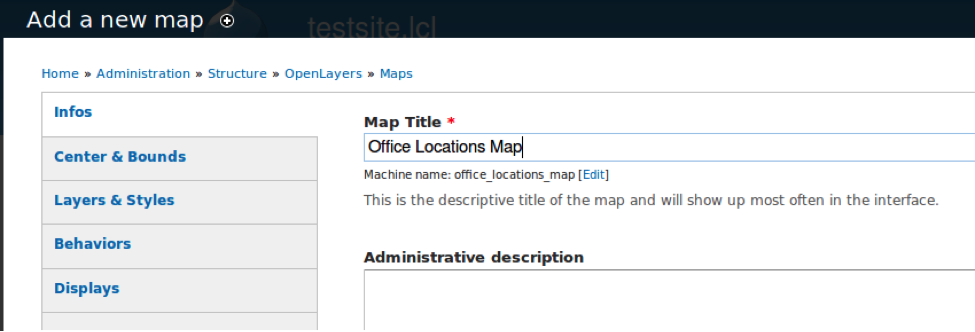
Navigate to admin -> structure -> openlayers -> maps and click the Add link.
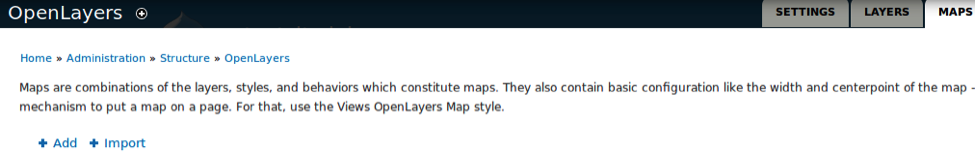
There are a lot of options available in the configuration screens but for now just enter the name for your map and click Save and edit. You’ll want to click save prior to clicking any of the links to other configuration screens.
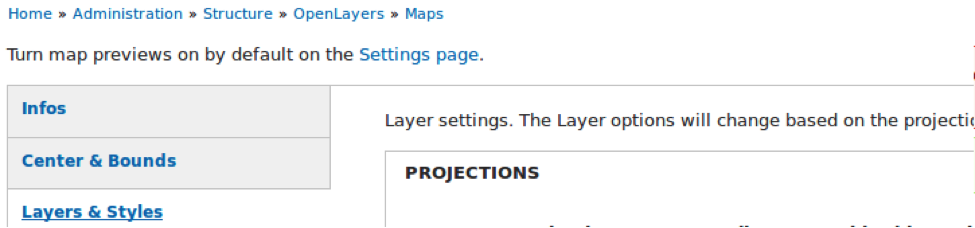
Click the Layers & Styles link to select which layers should be visible in the map.
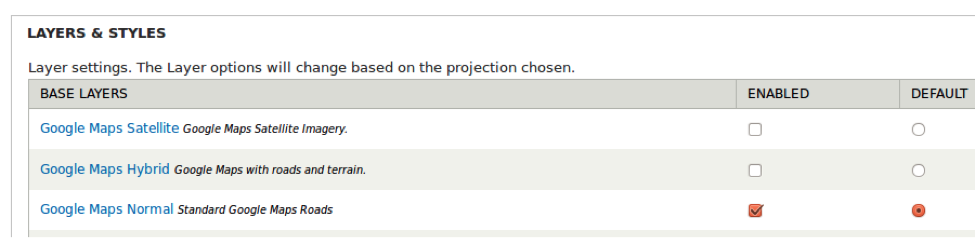
The first thing a map needs is a base layer. Again there are lots of options out of the box. Feel free to enable a few and see which you like.
Now scroll down and choose the overlay layer you want to display on this map. That’s the data overlay layer that you added to your Openlayers view.
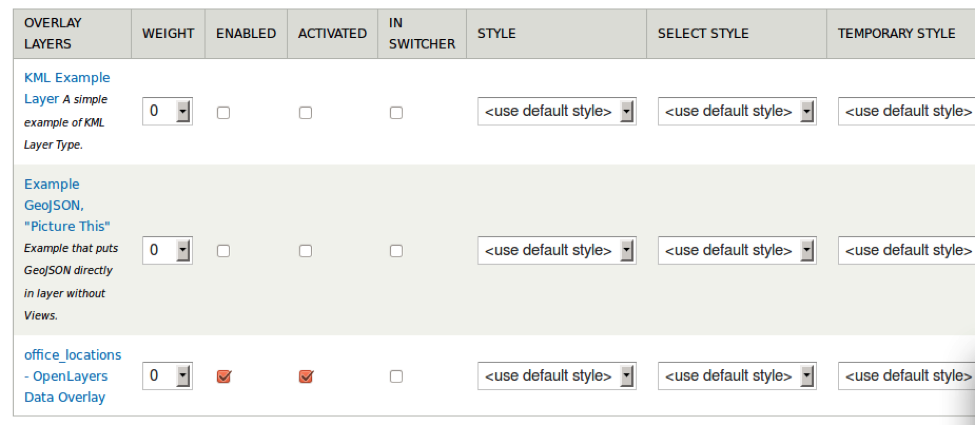
Check off Enabled and Activated. If you had multiple data layers you could configure the map to show only one or multiple layers at a time.
Now it’s time to revisit the Office Locations view. Go to the page display and click Settings in the format section.
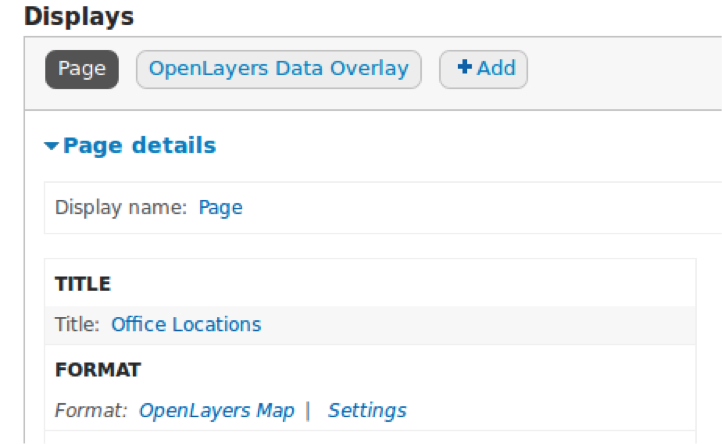
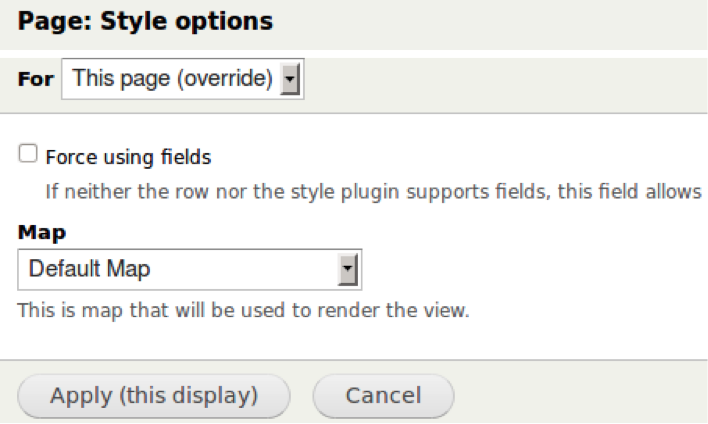
Click the drop down for the map that will be used to render the view.
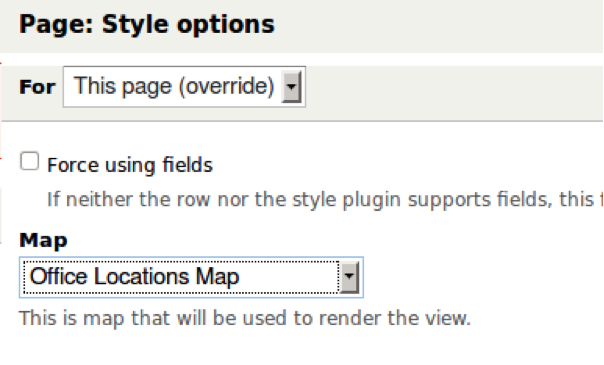
Choose the Office Locations map that we just created in the OpenLayers admin.
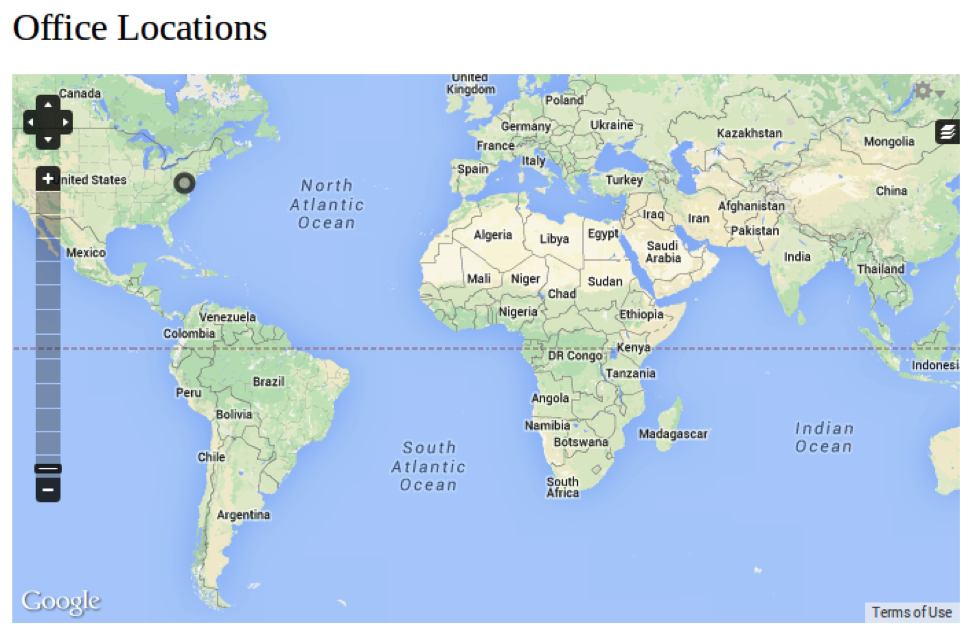
Click apply, save the view and navigate to the path for the page display.
We now have a map with a Drupal node with latitude and longitude information displayed.
In my next article we’ll look at some of the options in configuring the map in greater detail including setting the initial center point and adding behaviors like popup data.
In future articles we’ll add some awesome enhancements to OpenLayers maps including taking control of map functions with custom JavaScript.
- Log in to post comments
