Monitoring Weblogic Environments

If you work with Oracle Weblogic Server(WLS) in an enterprise environment, then you likely have many managed servers, clusters, applications, and services that you have to keep an eye on. The clusters and instances in a Weblogic domain add to the complexity of the application infrastructure. So how is a Weblogic administrator supposed to keep track of the various applications and services running across several different domains and servers? Currently, there are a few known existing resources and/or tools available that would be able to assist with monitoring as well as proactively maintaining the WLS environment:
- WLS Log Files
- WLS Console
- Oracle Guardian
- Uptime Software
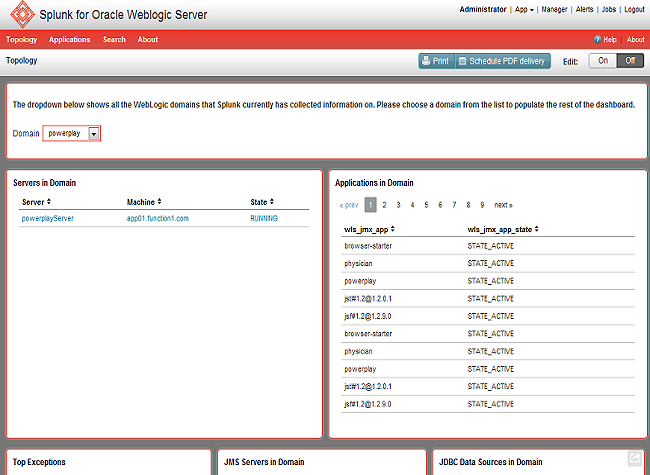
The latter three options above rely on the JMX (Java Management Extensions) data available from the Weblogic MBean Server active on the Java Virtual Machine(JVM). And yes, even the Weblogic Console, that you are familiar with, relies on JMX data to show information about the domain and/or applications. Tools such as Oracle Guardian can perform health checks on your domain by leveraging this JMX information. And let's not forget about the information sent to the weblogic log files. But to monitor a large environment would get cumbersome if the Weblogic administrator has to log in to each server to isolate issues on just one of the managed servers. Well , you say, there are log indexers such as Splunk which give me one place to check logs for an entire WLS environment. Yeah, let's add the weblogic logs to Splunk then! Oh wait ... on closer look at the logs, we see that not everything we want is available in the log files. So, we are still left with using separate tools to maintain and monitor an enterprise WLS environment. Well... not exactly... until now anyways. Here's where Function1's upcoming Oracle Weblogic App for Splunk comes in to save the day! With this app added to your Splunk deployment, Weblogic administrators will have a 'one-stop' tool to monitor their your WLS environment. You will be able to monitor several weblogic domains, and be able to drill-down to servers and applications to examine resource usage. In addition, you will able be able to examine domain-level services such as messaging systems , database connection pools, etc. To give you an idea of the app, here's a sneak peak of the
landing page that shows the topology for a selected domain.
This Splunk app is still being worked on by our Splunk developers, and will be ready for a beta release in the coming weeks. Please stay tuned for more updates on this app in the exciting weeks ahead. We will also be presenting the app at the next Splunk conference (.Conf2012) in Las Vegas. If you are planning to go, check out the breakout session called 'Splunk for Oracle Weblogic Server' and also look for us in the Partner Pavilion.
- Log in to post comments


Comments
balrog on September 17, 2012
Vasanth on September 20, 2012