Connecting the Puzzle Pieces: Ensuring Better Management, Organization, and Tracking for Every Team
By: Rishi December 01, 2015


No matter how small or large a team, enabling a methodology to understand "Who does what" can greatly improve process, organization, project management, and teaming structures. One of the most versatile tools for a team - outside of its staff and their expertise - is a roles and responsibilities chart. This kind of charting yields performance improvement and often can be an easy to create and easy to follow tool.
Although there are a multitude of different models for organizations and teams to visually map out a roles and responsibilities chart, this post focuses on two versions: 1) the simplest, most basic matrix, and 2) a common structured model, the RACI Model. To display the information in the basic version, one can organize responsibilities on the Y-axis of a table, and roles on the X-axis. This can be switched, but organizing in this manner allows for seamless transition into a RACI model.
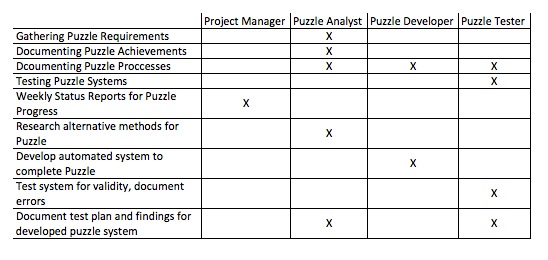
The example below shows the simplest basic model, with our roles across the top (X-axis), and responsibilities vertically across the left (Y-axis).
To complete this basic model, the tasks that a role may be responsible for are marked with an “X.” Without any other options, this may seem like a decent way to organize roles and responsibilities into a chart. Although this simple chart shows the basics of the team - roles, tasks, and responsibilities - we know that every team is much more complex. Continuing in our comparison of the numerous participles of a team to a puzzle - this charting model only brings the puzzle pieces together. Even if we complete this chart for the entire team, we will not have put the entire puzzle together - major sections of the image on the puzzle will be missing, but you will be able to somewhat know what image is being represented in the pieces.
Although the chart above does show the tasks which these roles are responsible for, every team member knows that tasks are somewhat shared, or in the least, that tasks can involve other team members. To accurately represent the organization of the team, we must upgrade the basic chart above. One option is to provide greater detail to the tasks as well as more roles on the X or Y-axis. But, this will just increase the size of our chart. How do we incorporate the necessary changes to upgrade the chart, but keep the chart the same size?
Introducing…the RACI Model for Roles and Responsibilities charting. RACI stands for Responsible, Accountable, Consulted, and Informed. The RACI model upgrades the basic table by assigning one of these words to each role and responsibility, instead of just an X. The general meaning of these terms is provided below:
-
R - Responsible - the team member responsible for completing a given task, the team member who completes a particular process step or leads the people who do;
-
A - Accountable - the team member that makes sure that work gets done/ensures the correct decision gets made, the team member who is held accountable by top management for implementation or completion of a task;
-
C - Consulted - one or more team members who must be consulted with, prior to a given task being completed, the team member whose advice is sought before a final decision is made and / or implementation takes place;
-
I - Informed - one or more team members who must be informed after a task is completed successfully, or a decision is made, the team member or members who are notified once a final decision has been made or after implementation of the task.
The RACI model enhances the basic roles and responsibilities matrix by providing detail beyond just marking which role is responsible for which task. To successfully execute a RACI model, instead of entering “X” values into each cell of the chart, add one or more of the letters, R, A, C, or I, to signify which part of RACI best relates to that task and role. In the basic model, we know that “Weekly Status Reports for Puzzle Progress” is indeed a task for which a Project Manager is responsible and accountable; however, any team member also knows that a PM will consult each team member to create a status report. The basic model of a roles and responsibilities chart cannot show this relationship. A RACI model, however, can provide this and greater detail. The example below shows our original table of roles and tasks, with the letters R, A, C, and I, provided.
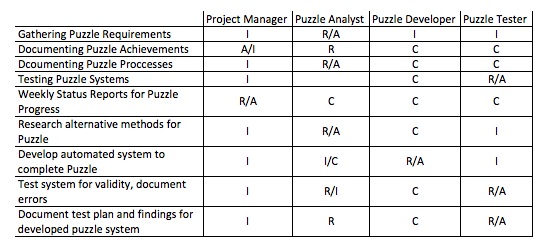
In this version, we are showing some roles that just one ‘letter’ associated to it (usual scenario), and some cells have more than one ‘letter’ associated to it.
The example in this post can always be improved through RACI chart best practices - use the following best practices to make a RACI model better:
-
Avoid generic or too-broad activities (i.e. “Attend meetings”);
-
Describe each task with an appropriate verb, including but not limited to Review, Document, Inspect, Monitor, Manage, Evaluate, Launch, Develop, etc.;
-
Tasks should be succinct and short, not long descriptions of people or roles;
-
While entering RACI codes, one should not be afraid to use multiple in one cell, but should be wary of over doing this;
-
Use a spreadsheet to create the RACI chart, but include the meanings of the RACI for users/readers who may be unaware of this charting technique; and
-
Include as many C’s and I’s as needed - team members roles should be overwhelmed by tasks.
Why do we want to use this approach to organize our team and its responsibilities? Beyond just connecting the puzzle pieces, the RACI model reduces the risk of misunderstanding within a team, helps eliminate duplicated efforts, ensures that the correct team members are responsible for the correct tasks, provides clarification to roles and responsibilities across a team, and brings the puzzle pieces of a diverse team together, connecting all the roles to their responsibilities.
- Log in to post comments
