A Little Bird told me...

Banner Artwork from jasonpruett.com
You can imagine the scene in the cartoon above playing out in the office of a marketing professional in almost any corporate environment these days. In this case, the little bird is the data mining wizard that was brought in, and the big mountain ram is the marketing executive finding out about all the beautiful nuggets of information that had been discovered, all while he's dreaming up the potentially useful (clever and/or evil muuhahahaha) things he can do with those nuggets. As I mentioned in my previous installment about the Data Mining Process I will focus this time on actual modeling part of the CRISP-DM process.
Machine Learning (Data Mining) comes in two forms, supervised and unsupervised. When a computer (algorithm) learns based on a set of data with known labels (for example purchaser vs. non-purchaser) the classification is said to be a form of supervised learning. This is the type of data mining synonymous with Predictive Analytics. Usually there is lots of transactional history with known outcomes from which to derive a classification model. However, when the number and values of class labels is not known ahead of time and the machine discovers them from the data, the type of machine learning in this case is said to be unsupervised learning. In unsupervised learning, the data miner identifies a metric or formula that the algorithm uses to determine how "close" 2 data records (for example a customer record) are to each other. The algorithm then creates distinct clusters based on this distance metric. An example of unsupervised learning could be the automatic discovery of news categories from a feed of news articles based on the text that occurs within the articles themselves. I just wanted you to be aware of the various types of ML, however we will focus on supervised learning for our modeling exercise.
Predictive Analytics is the term used these days, to refer to a set of techniques in computer science known to address the problem of Classification. What does it mean to classify? Well it basically means to affix a label to something or someone based on what is observed. Can stereotyping be a form of classification? Yup it sure can. Sometimes stereotyping can be a useful tool (yes controversial I know) and sometimes it can come back to bite you in the butt (so to speak). The same is exactly true of predictive (classification) models. We'll see why as we explore one method of classification known as decision tree induction.
There are some "famous" decision tree methods and one specifically is called ID3 developed by Ross Quinlan, while a more robust extension of ID3 is called C4.5. While I won't bore you with the nitty gritty of the algorithm, I will say that these classification algorithms work based on the concept of Information Gain. Let's take the following example data set related to technology company profit and see how it works.
|
attribute |
values |
|
age |
old, midlife, new |
|
competition |
no, yes |
|
type |
hardware, software |
Fig. 1: Potential Model Attributes
|
age |
competition |
type |
profit |
|
old |
yes |
swr |
down |
|
old |
no |
swr |
down |
|
old |
no |
hwr |
down |
|
mid |
yes |
swr |
down |
|
mid |
yes |
hwr |
down |
|
mid |
no |
hwr |
up |
|
mid |
no |
swr |
up |
|
new |
yes |
swr |
up |
|
new |
no |
hwr |
up |
|
new |
no |
swr |
up |
Fig. 2: Tech. Company Profit Example Dataset
Looking at Fig. 2, the column to the far right, Profit, is the class value or the value that we are trying to predict based on values observed in the 3 columns to its left. The ID3 algorithm evaluates each of the 3 attributes (columns to the left of profit in Fig. 2) and determines which one to use as the base (aka root) of the tree. It does this by asking, if I branch on this attribute by how much does it reduce the randomness seen in the predicted values? So for example, if the "competition" attribute had values where nearly all 'yes' values corresponded to class values of 'down' and all 'no' values for the attribute had class values of 'up' then it would deem the attribute as informative on predicting the class value and use it as the next branch point. Obviously this is very mathemetical but that's the gist of it. The algorithm continues selecting attributes as branch points and removing them from future consideration (the algorithm is considered greedy) in the future until all attributes have been used or excluded.
The University of Waikato in New Zealand has developed a Data Mining Workbench known as WEKA and can be downloaded here. This workbench is very easy to install and I will skip those details and dive straight into its use. After installing and launching the application you will see 4 options as seen in Fig. 3. Choosing 'Explorer' results in launching Weka Explorer as seen in Fig. 4 below.

Fig. 4: Weka Explorer: Preprocess Tab
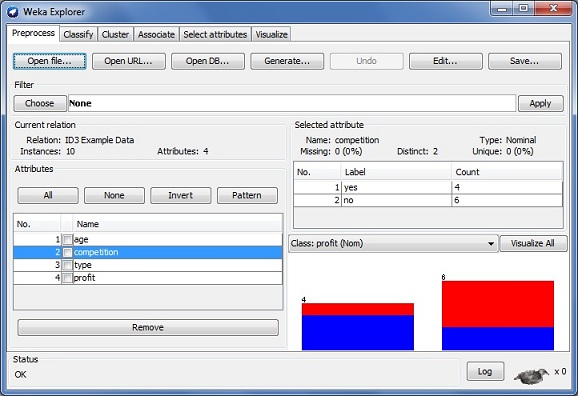
The application is very flexible and allows you to import data in .csv format and the result of clicking 'Open file' and selecting the .csv file containing our example data can be seen in Fig. 4. Now that the system has been loaded with the example data we can navigate to the classify tab and Choose the ID3 classifier as seen in Fig 5. In the case depicted below, I have chosen to use 66% of the example data to train the decision tree model and 33% to test the model after it has been created (in this case 7 rows to train and 3 to test). After clicking 'Start' the model is built and the results are displayed in the Classifier output window. The results can be seen in Fig. 6.
Fig. 5: Weka Explorer: Classify Tab
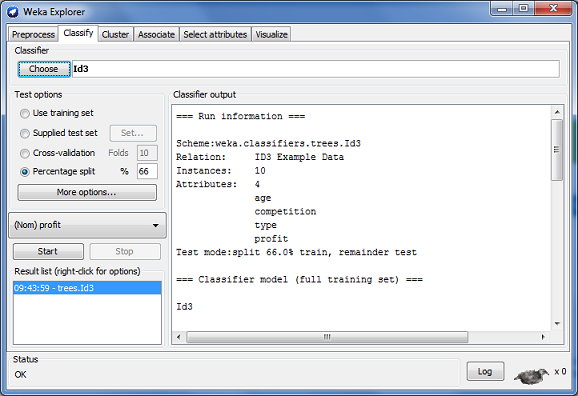
Fig. 6: Classify w/ ID3 Output
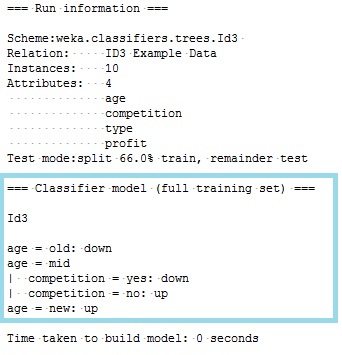
The resulting model is in the form of a tree. However because of the crude display, the tree is tiled out from left (root) to right (leaves) instead of top to bottom. In this case, the tree starts by splitting on the age attribute and then the competition attribute. The attribute 'type' was completely left out as it was deemed to have negligible value in determining the class value for profit based on the evailable data in the dataset. The ID3 model highlighted in Fig. 6 above can be translated into very understandable rules which will be used to "predict" all future class values for profit. This is also an advantage to using decision trees as it demystifies the "black box" for marketers.
The rules are as follows:
- IF age = old THEN then profit=down
- IF age = mid AND competition=yes THEN profit=down
- IF age = mid AND competition=no THEN profit=up
- If age=new THEN profit=up
I completely left out model evaluation but in the interest of not writing a novel I will stop here and leave it to you if you're interested. I will say that models are not 100% accurate (often times far from it) and understanding the impact of getting a prediction right or wrong is a big part of the DM process. So hopefully you found this brief look under the hood of the data mining and modeling process informative and I hope it has taken some of the mystery out of this new and enigmatic business tool. If you are interested in learning more I recommend this introduction on the applications of Machine Learning to Marketing, Sales and CRM (Data Mining Techniques).
Until next time!
-Mitul
- Log in to post comments
